

Last week ETH failed to reach its 2021 record high. The number two crypto missed the jump by less than two percentage points, stopping short of $4,864. After reduced buying from corporate treasuries and outflows from Ethereum spot ETFs, the price corrected down to $4,084. From there, Ether stabilized and recovered toward the 9-day EMA around $4,275. The key question now is whether the correction has ended and what resistance levels need to be reclaimed for a turnaround.
At the moment, ETH is pausing. After record inflows into spot ETFs the previous week, this week brought outflows worth $866 million. Despite some experts calling Ethereum the biggest long-term crypto investment, many traders are taking profits after the price doubled within just two months. For now, ETH was stopped at the last barrier highlighted in the previous analysis. Heavy short positions on CME could increase the risk of further downside. Bulls, however, managed to defend the cross-support from December highs and the upward trendline.
Short-Term Levels
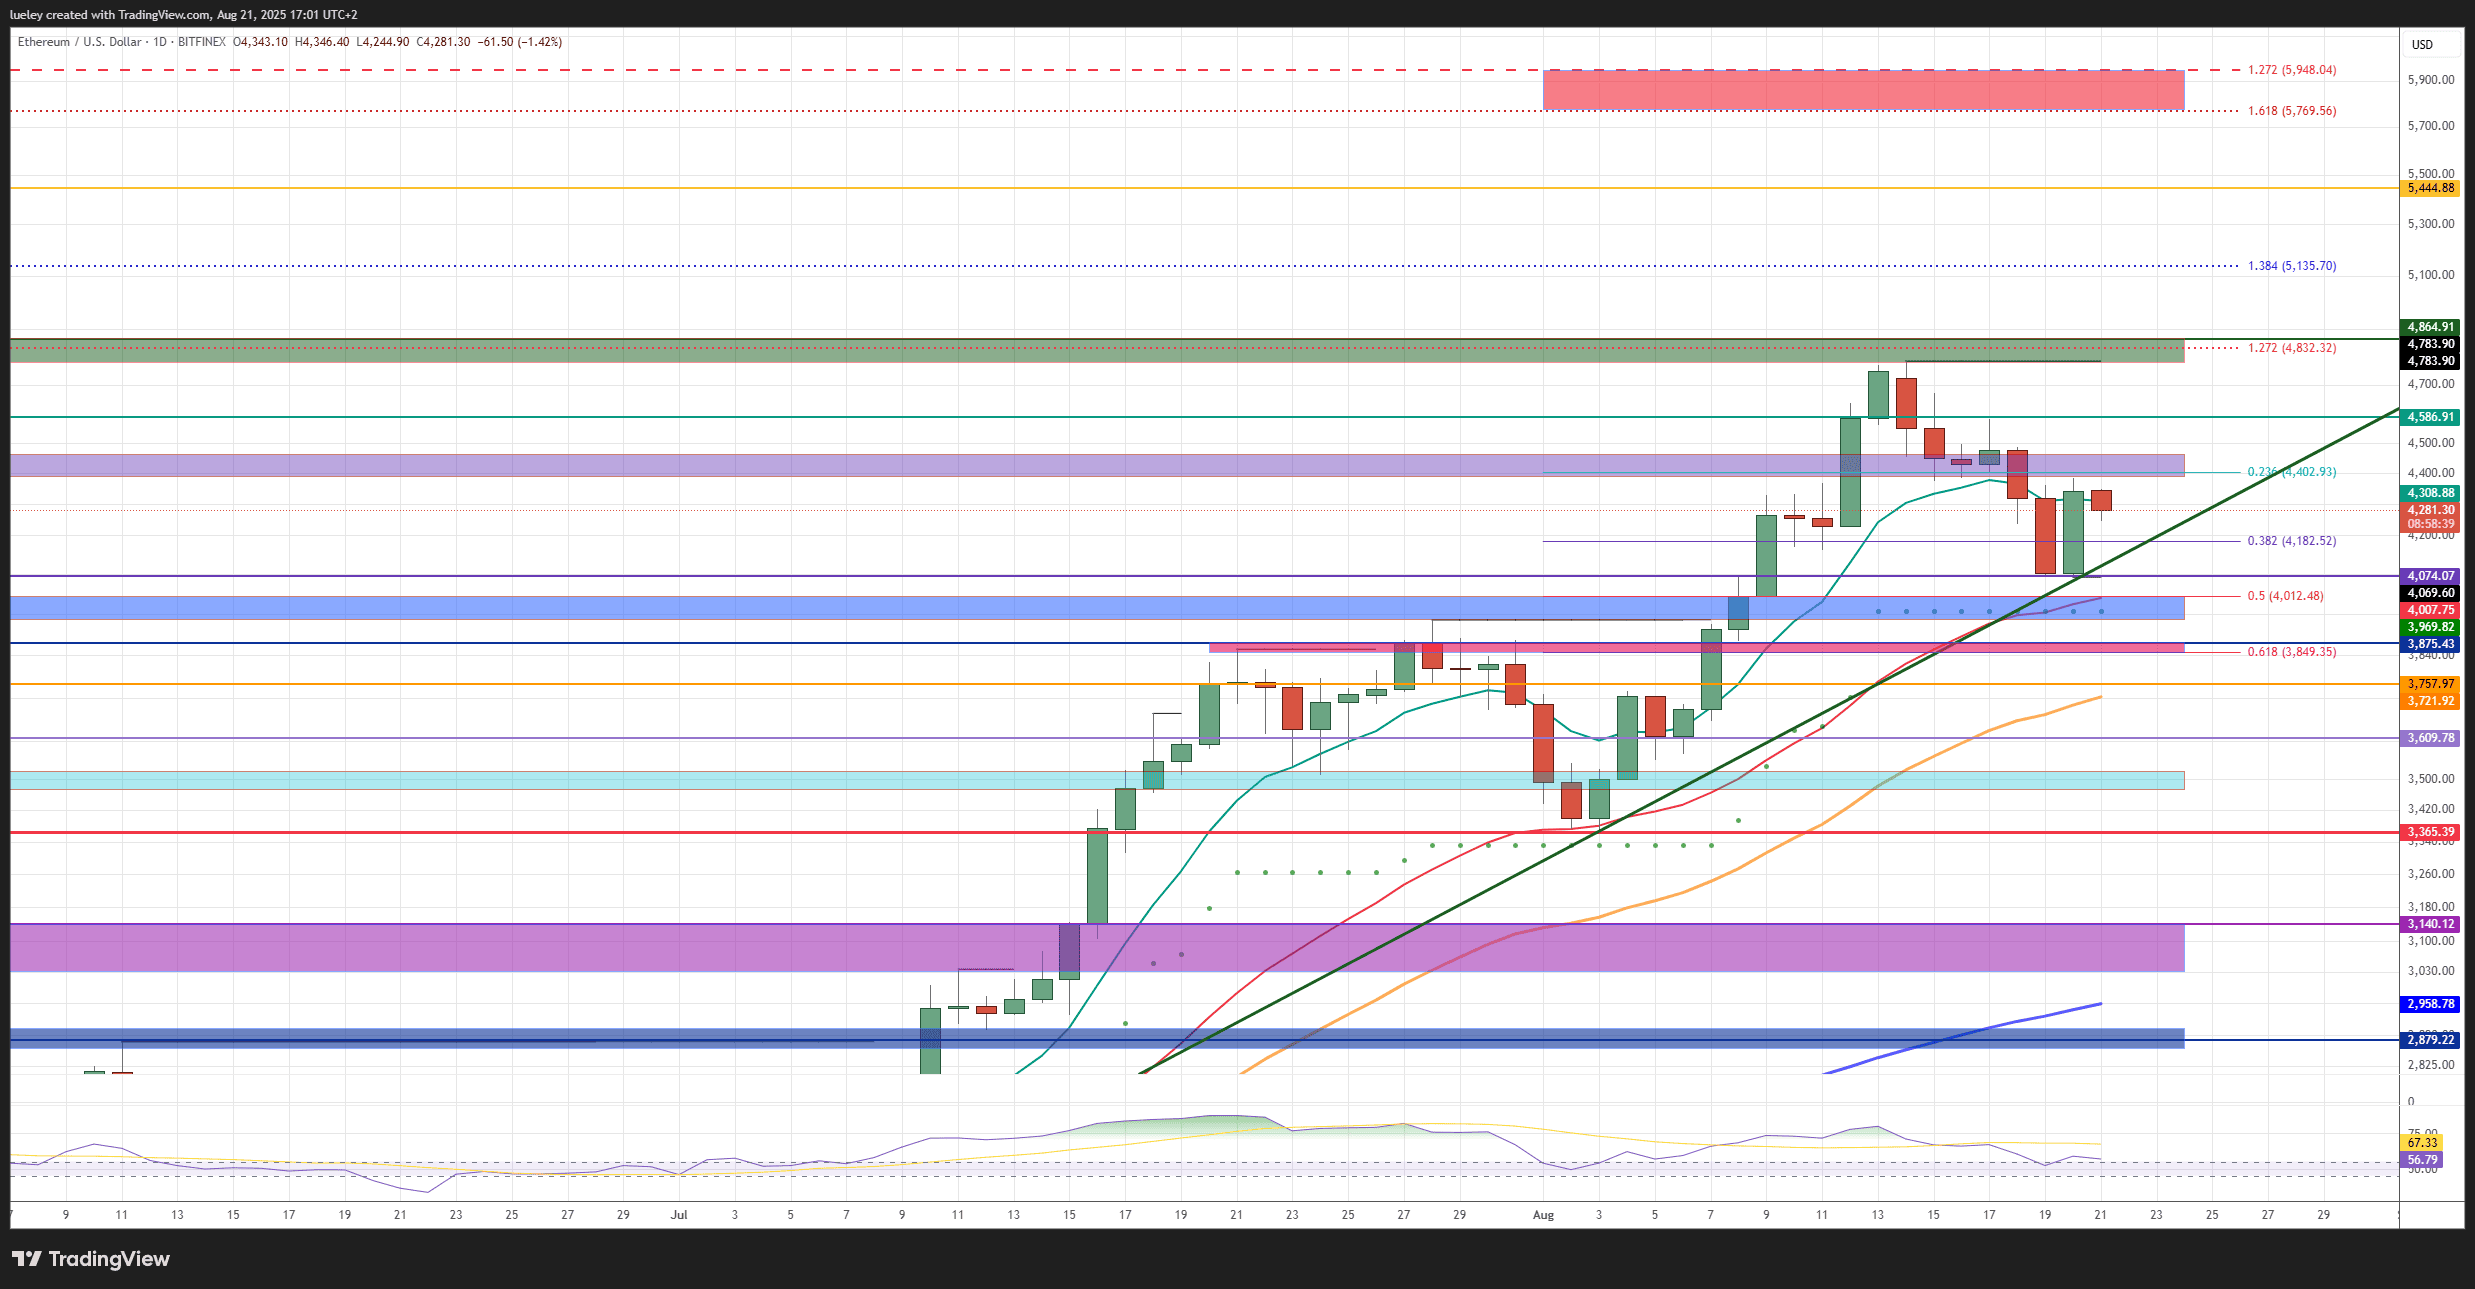
Ethereum must hold above the 9-day EMA and then retake resistance between $4,373 and $4,464 to aim for the next target at $4,586. If the correction deepens and new weekly lows appear, the focus shifts to support between $4,012 and $3,945, an area defined by the 50% Fibonacci retracement, the Supertrend, and last month’s high.
Bullish Targets
- $4,312
- $4,388–$4,464
- $4,586
- $4,782–$4,864
- $5,135
- $5,444
- $5,769–$5,948
The weakness in the Nasdaq ahead of Jerome Powell’s August 22 press conference dragged crypto lower. Still, if ETH stays above the cross-support, the downtrend may soon end. A breakout above $4,464 would bring $4,586 back into play. A daily close above this resistance would open the path toward the monthly high in the green zone on the chart.
If ETH reaches $4,797–$4,865 and avoids another pullback, the chance of retesting the 2021 high increases. The Fibonacci extension at $4,832 is another obstacle. Clearing it could send ETH quickly toward $5,135.
Holding above the green zone is crucial to confirm new highs. If the trend continues north, investors will watch $5,444 next. That target comes from the 361% Fibonacci extension. Beating it could push ETH into the maximum target range of $5,769–$5,948, derived from the 161% extension of the latest rally and the larger 127% projection.
Bearish Targets
- $4,182
- $4,074
- $4,012–$3,945
- $3,875–$3,849
- $3,757
- $3,609
- $3,521–$3,473
- $3,365
- $3,140–$3,032
The bears stepped in at the last moment to block a breakout to 2021 levels. ETH corrected 15% down to $4,074. For bears, the goal is now to cap price under the purple resistance zone. Ideally they want ETH rejected at the 9-day EMA and sent back to $4,182. A break below this would bring the uptrend line and weekly low of $4,074 into play. Dropping under that zone would open the path to $4,012–$3,945.
Failure to hold this multiple support area would mean a slide toward the golden pocket between $3,875 and $3,849. This level acted as resistance in July and now serves as key support. If buyers stay away, $3,757 comes into focus. Continued weakness could extend the correction to $3,609.
If even that doesn’t hold, the turquoise zone between $3,521 and $3,473 is next, with the risk of testing monthly lows increasing. A deeper slide toward $3,140–$3,032 cannot be ruled out if US equities undergo a stronger correction in the next six weeks, pulling crypto with them. Just below, the rising 200-day EMA is also positioned as support.
Indicators
On the daily chart, RSI has fallen back to neutral between 45 and 55. Holding this area could allow the uptrend to continue. On the weekly chart, RSI is no longer overbought, leaving room for further upside. The monthly RSI at 63 still points north, reinforcing the broader bullish outlook for Ethereum.