

Last week, the US regulator cut the interest rate by 25 basis points to 3.75% and announced the launch of Treasury bond purchases totaling $40.0 billion, while not ruling out a pause in the easing cycle amid persistently elevated inflation. Labor market data released after the meeting confirmed further signs of cooling: unemployment rose to 4.6%, the highest level since 2021, while nonfarm payrolls increased by 64.0 thousand following a decline of 105.0 thousand previously. As a result, policymakers once again face a trade-off between supporting employment and containing consumer price growth. Against this backdrop, digital assets accelerated their decline, total crypto market capitalization fell below $3.0 trillion for the third time this month, and the Fear & Greed Index returned to the “extreme fear” zone, settling at 16.
At the same time, XRP is receiving partial support from developments in crypto exchange-traded funds (ETFs). While spot Bitcoin and Ethereum ETFs have seen consistent outflows over recent sessions, Ripple-related ETFs are showing the opposite trend. Since their launch in mid-November, inflows have remained steady and have already exceeded $1.0 billion. Analysts believe this reflects risk diversification by institutional investors, who are reducing exposure to flagship crypto instruments in favor of alternative assets.
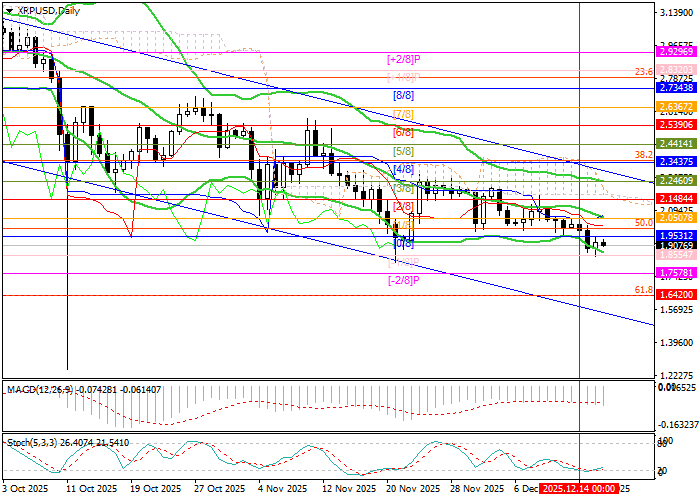
Support and resistance levels
The instrument is moving within a medium-term bearish trend, forming a corresponding descending channel. Prices remain close to the 1.8554 level (Murray [–1/8]); a sustained break below this area would open the way toward 1.6420 (Fibonacci retracement 61.8%). Conversely, consolidation above 2.1484 (Murray [2/8]) and the middle line of the Bollinger Bands could allow prices to exit the descending range through the upper boundary, targeting 2.3437 (Murray [4/8], Fibonacci 38.2%) and 2.5390 (Murray [6/8]).
Technical indicators continue to signal selling pressure: Bollinger Bands are turning lower, the MACD histogram is expanding, and the Stochastic oscillator remains flat near oversold territory.
Resistance levels: 2.1484, 2.3437, 2.5390.
Support levels: 1.8554, 1.6420.
Trading scenarios and XRP/USD outlook
Short positions can be considered below the 1.8554 level with a target at 1.6420 and a stop-loss at 2.0000. Time horizon: 5–7 days.
Long positions can be considered above the 2.1484 level with targets at 2.3437 and 2.5390, and a stop-loss at 2.0200.
Scenario
| Timeframe | Weekly |
| Recommendation | SELL STOP |
| Entry point | 1.8550 |
| Take Profit | 1.6420 |
| Stop Loss | 2.0000 |
| Key levels | 1.6420, 1.8554, 2.1484, 2.3437, 2.5390 |
Alternative scenario
| Recommendation | BUY STOP |
| Entry point | 2.1490 |
| Take Profit | 2.3437, 2.5390 |
| Stop Loss | 2.0200 |
| Key levels | 1.6420, 1.8554, 2.1484, 2.3437, 2.5390 |
