

On the daily chart, HYPE still shows a constructive setup. The 50-day EMA has proven itself as dynamic support, holding firm during the last pullback and underlining its importance in the current market.
A notable development is the formation of a larger ascending triangle, typically viewed as bullish. This pattern suggests the price is consolidating while maintaining upward pressure. A breakout above the upper boundary of the triangle could trigger a strong upside move. The heatmap supports this view, showing a significant liquidity pool just above the current range that could quickly be tapped in case of a breakout.
Indicators back up this scenario: the MACD is showing a fading negative histogram, hinting at weakening selling pressure. If momentum flips positive, breakout odds increase sharply. Meanwhile, the RSI is holding above 50, highlighting sustained buying interest and overall market strength.
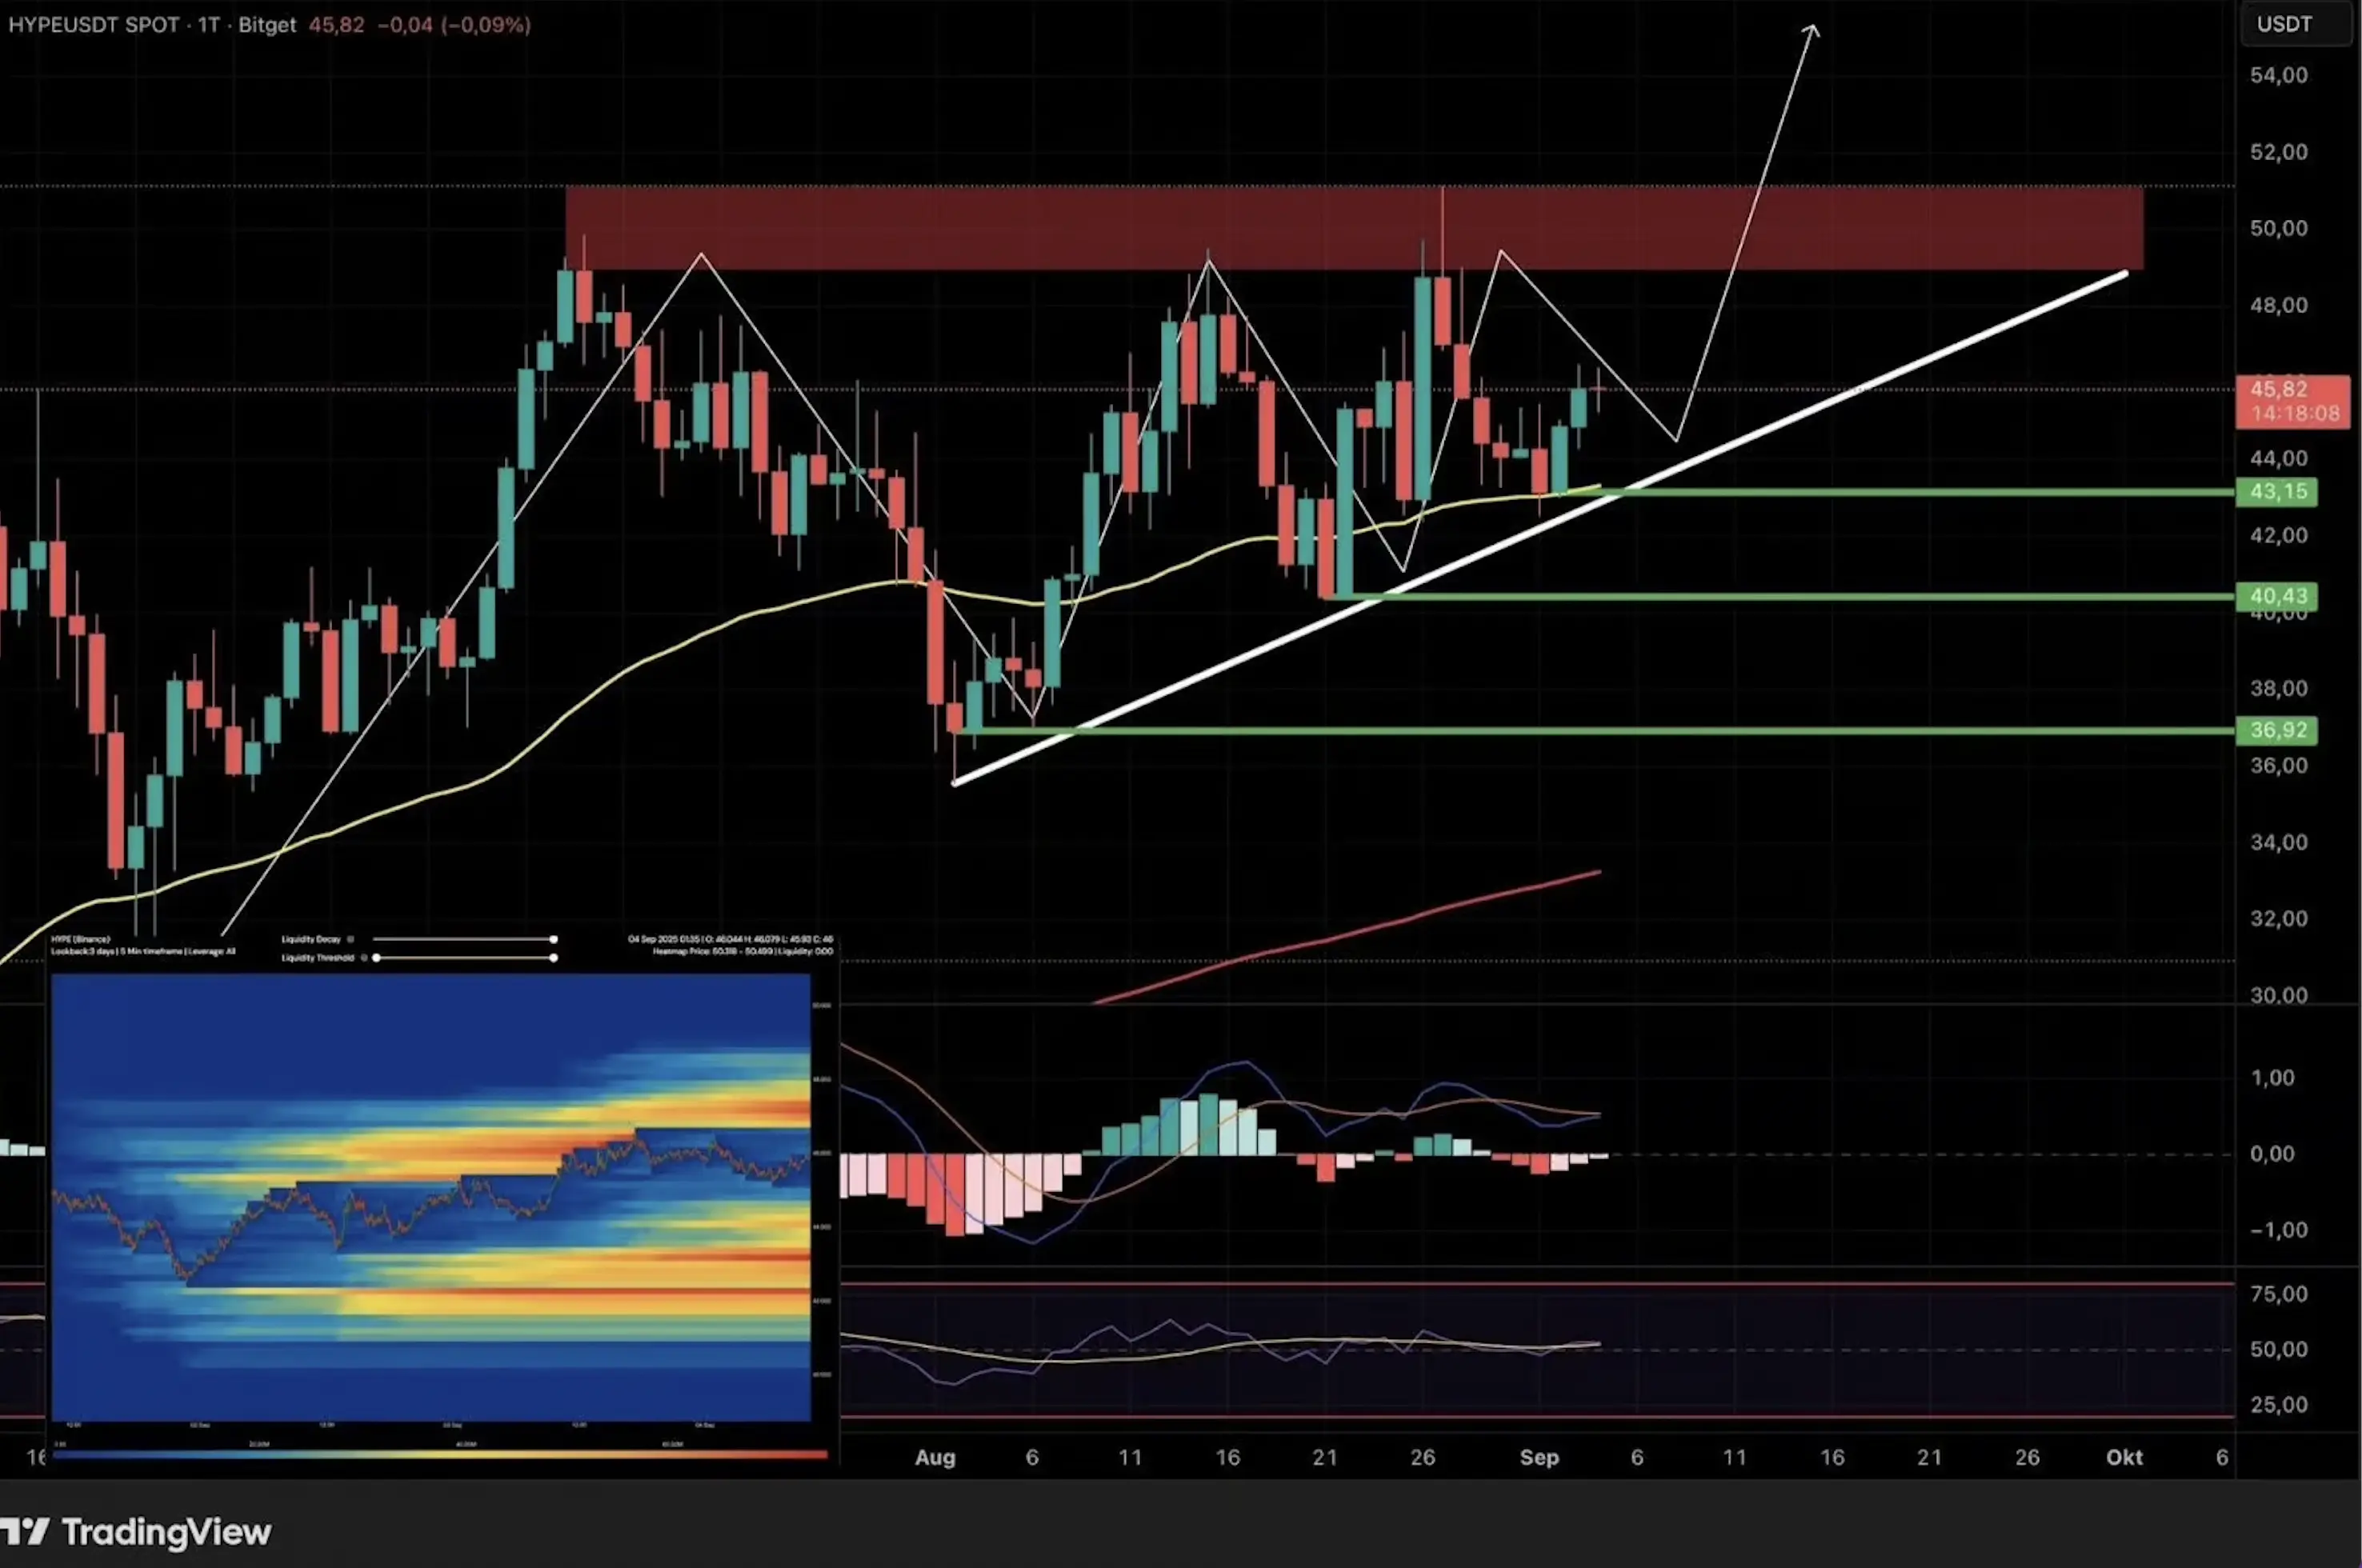
Daily candlestick chart of Hyperliquid with trendlines, support and resistance levels, technical indicators, and a projected upward move. Inset shows a trading activity heatmap. Source: TradingView
4-Hour Chart: Watching Key Support Zones
On the 4H chart, HYPE is once again testing the 50 EMA and the green support line. This zone is acting as crucial short-term support; holding it could set the stage for another move toward the upper yellow trendline. Only once this area is confirmed does a retest of resistance look realistic.
Indicators provide a more nuanced view. The MACD suggests possible negative momentum, which could add short-term pressure and trigger a retest of the support zones. At the same time, the liquidation heatmap shows a cluster of long positions in the current price area. A dip could flush these positions before the market turns higher again.
Another factor is expected market volatility, amplified by this week’s macro data releases. Bitcoin remains the dominant driver: if BTC makes a sharp move, altcoins like HYPE will likely follow. Thus, HYPE’s short-term outlook depends heavily on Bitcoin’s broader trend.
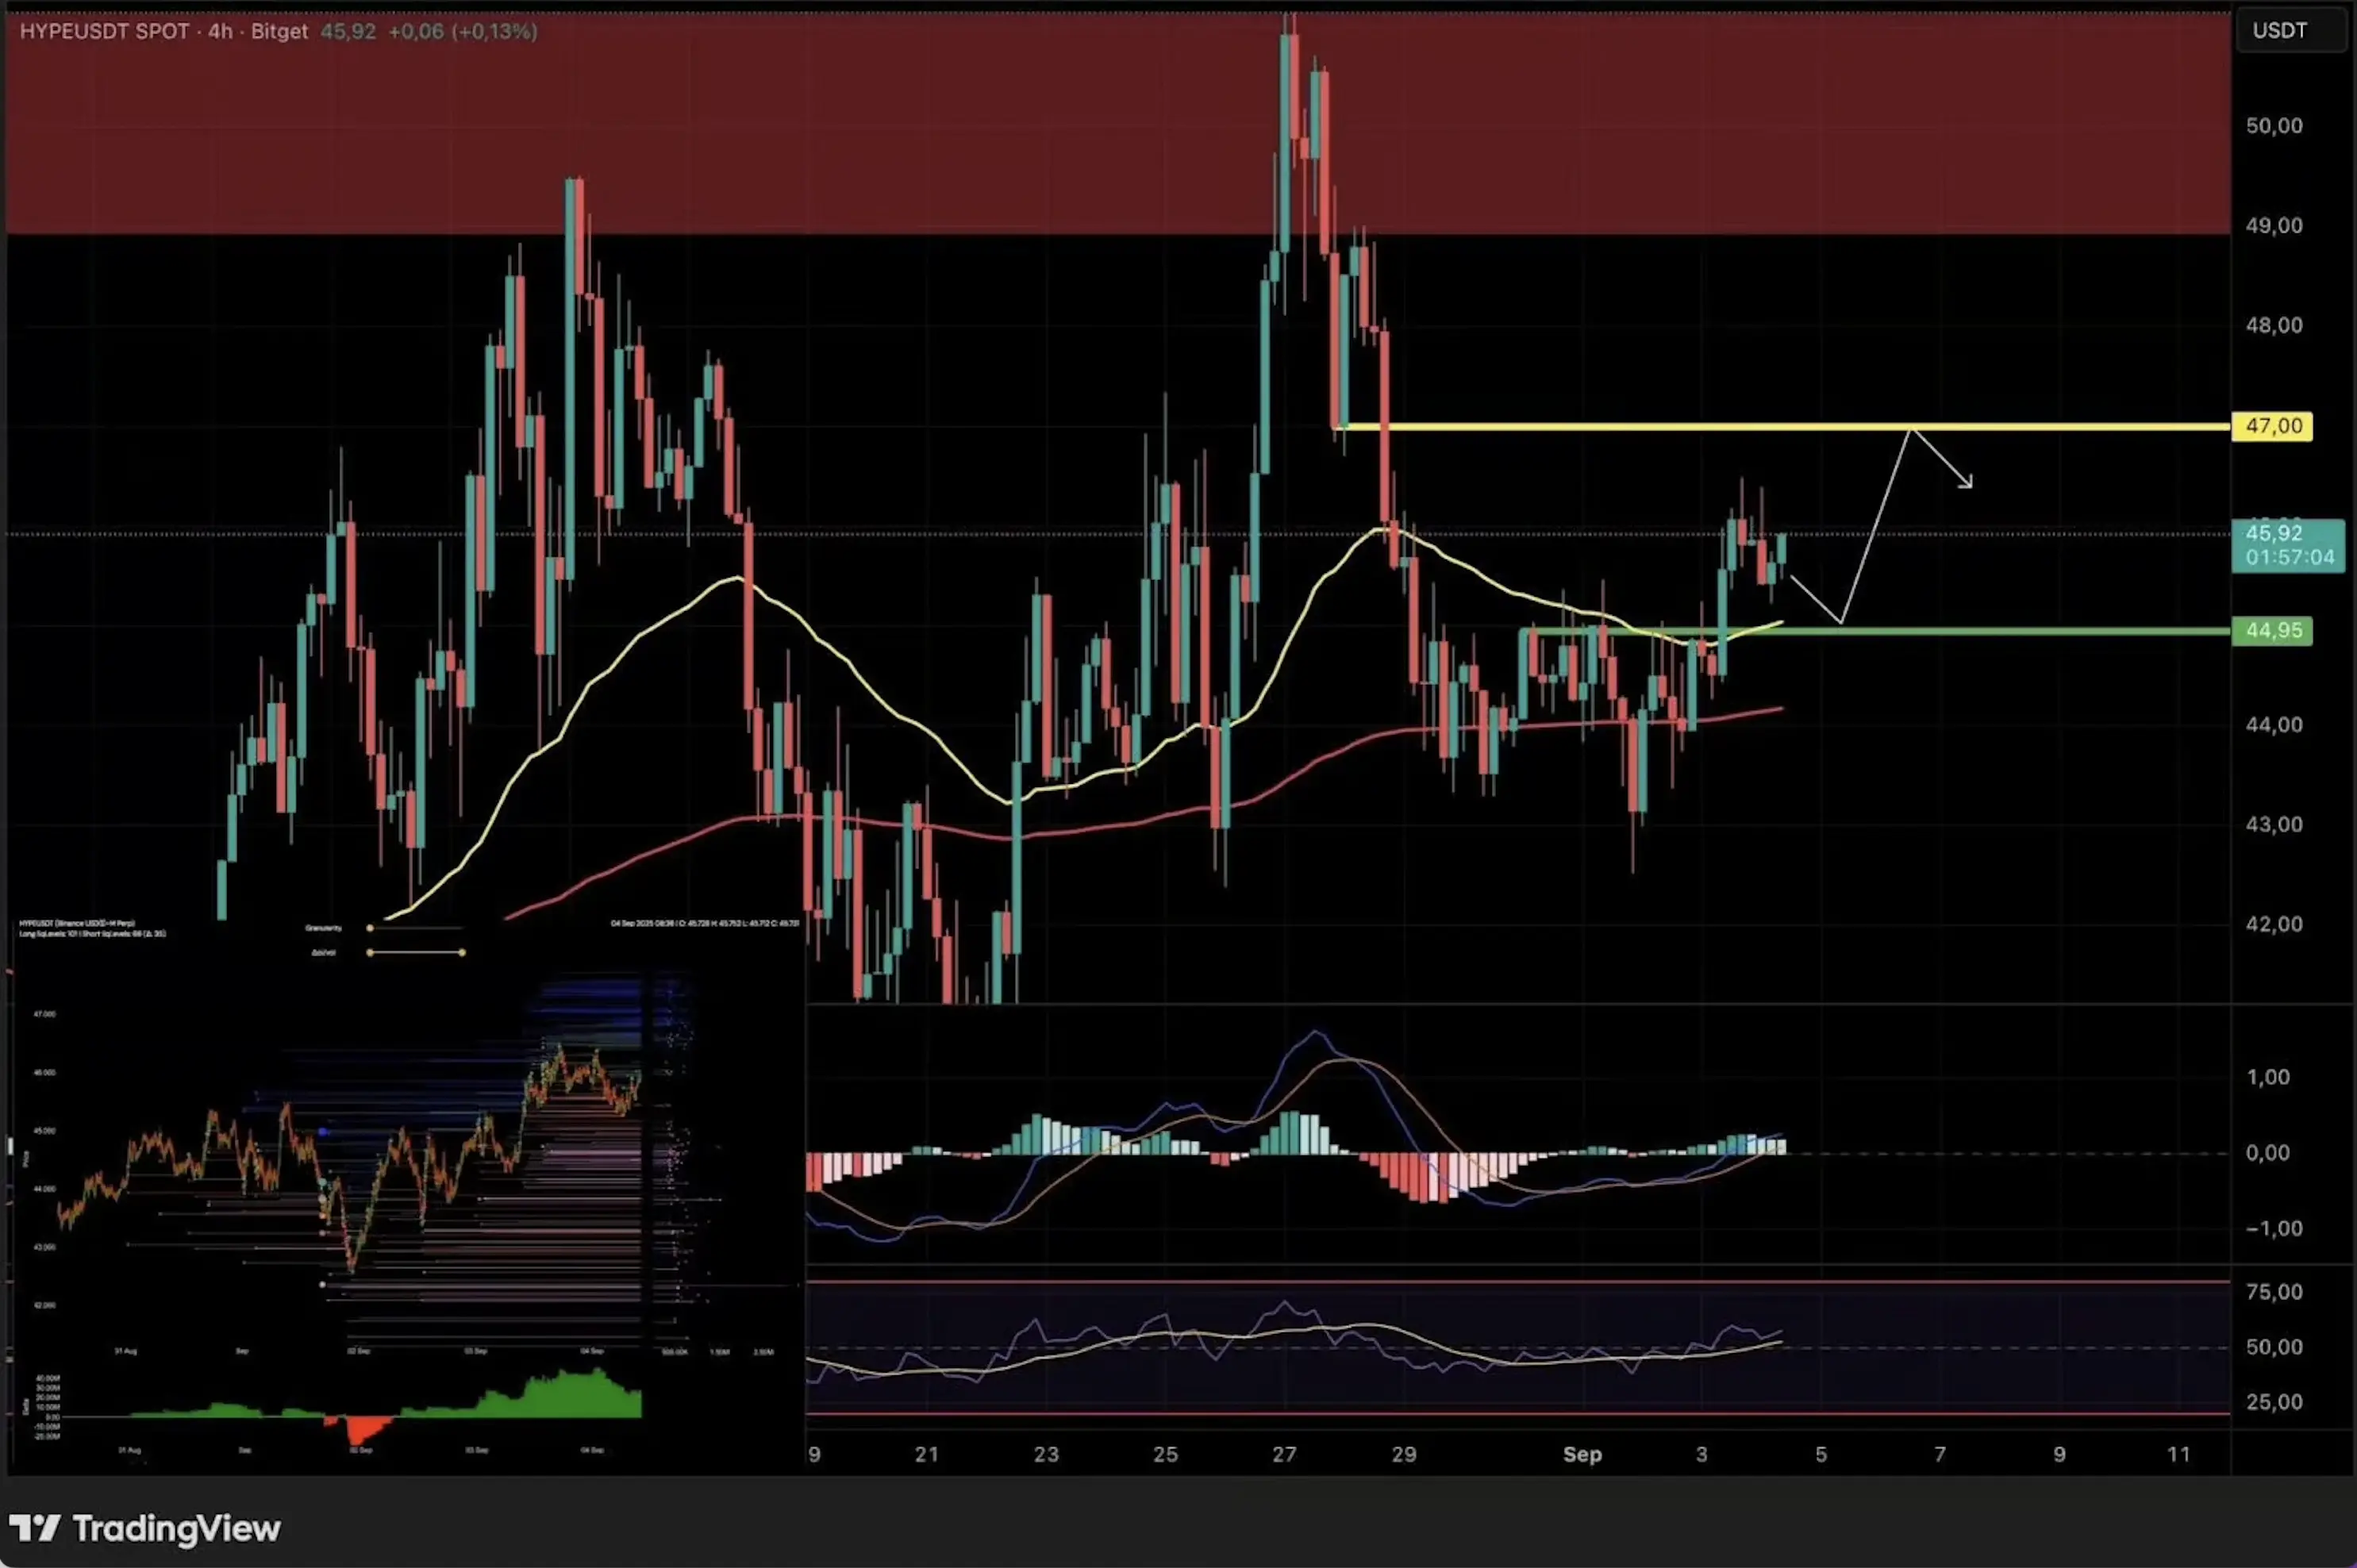
4H candlestick chart of Hyperliquid with support and resistance zones, moving averages, technical indicators, and a heatmap for liquidation levels. Source: TradingView
