

Outlook for XRP
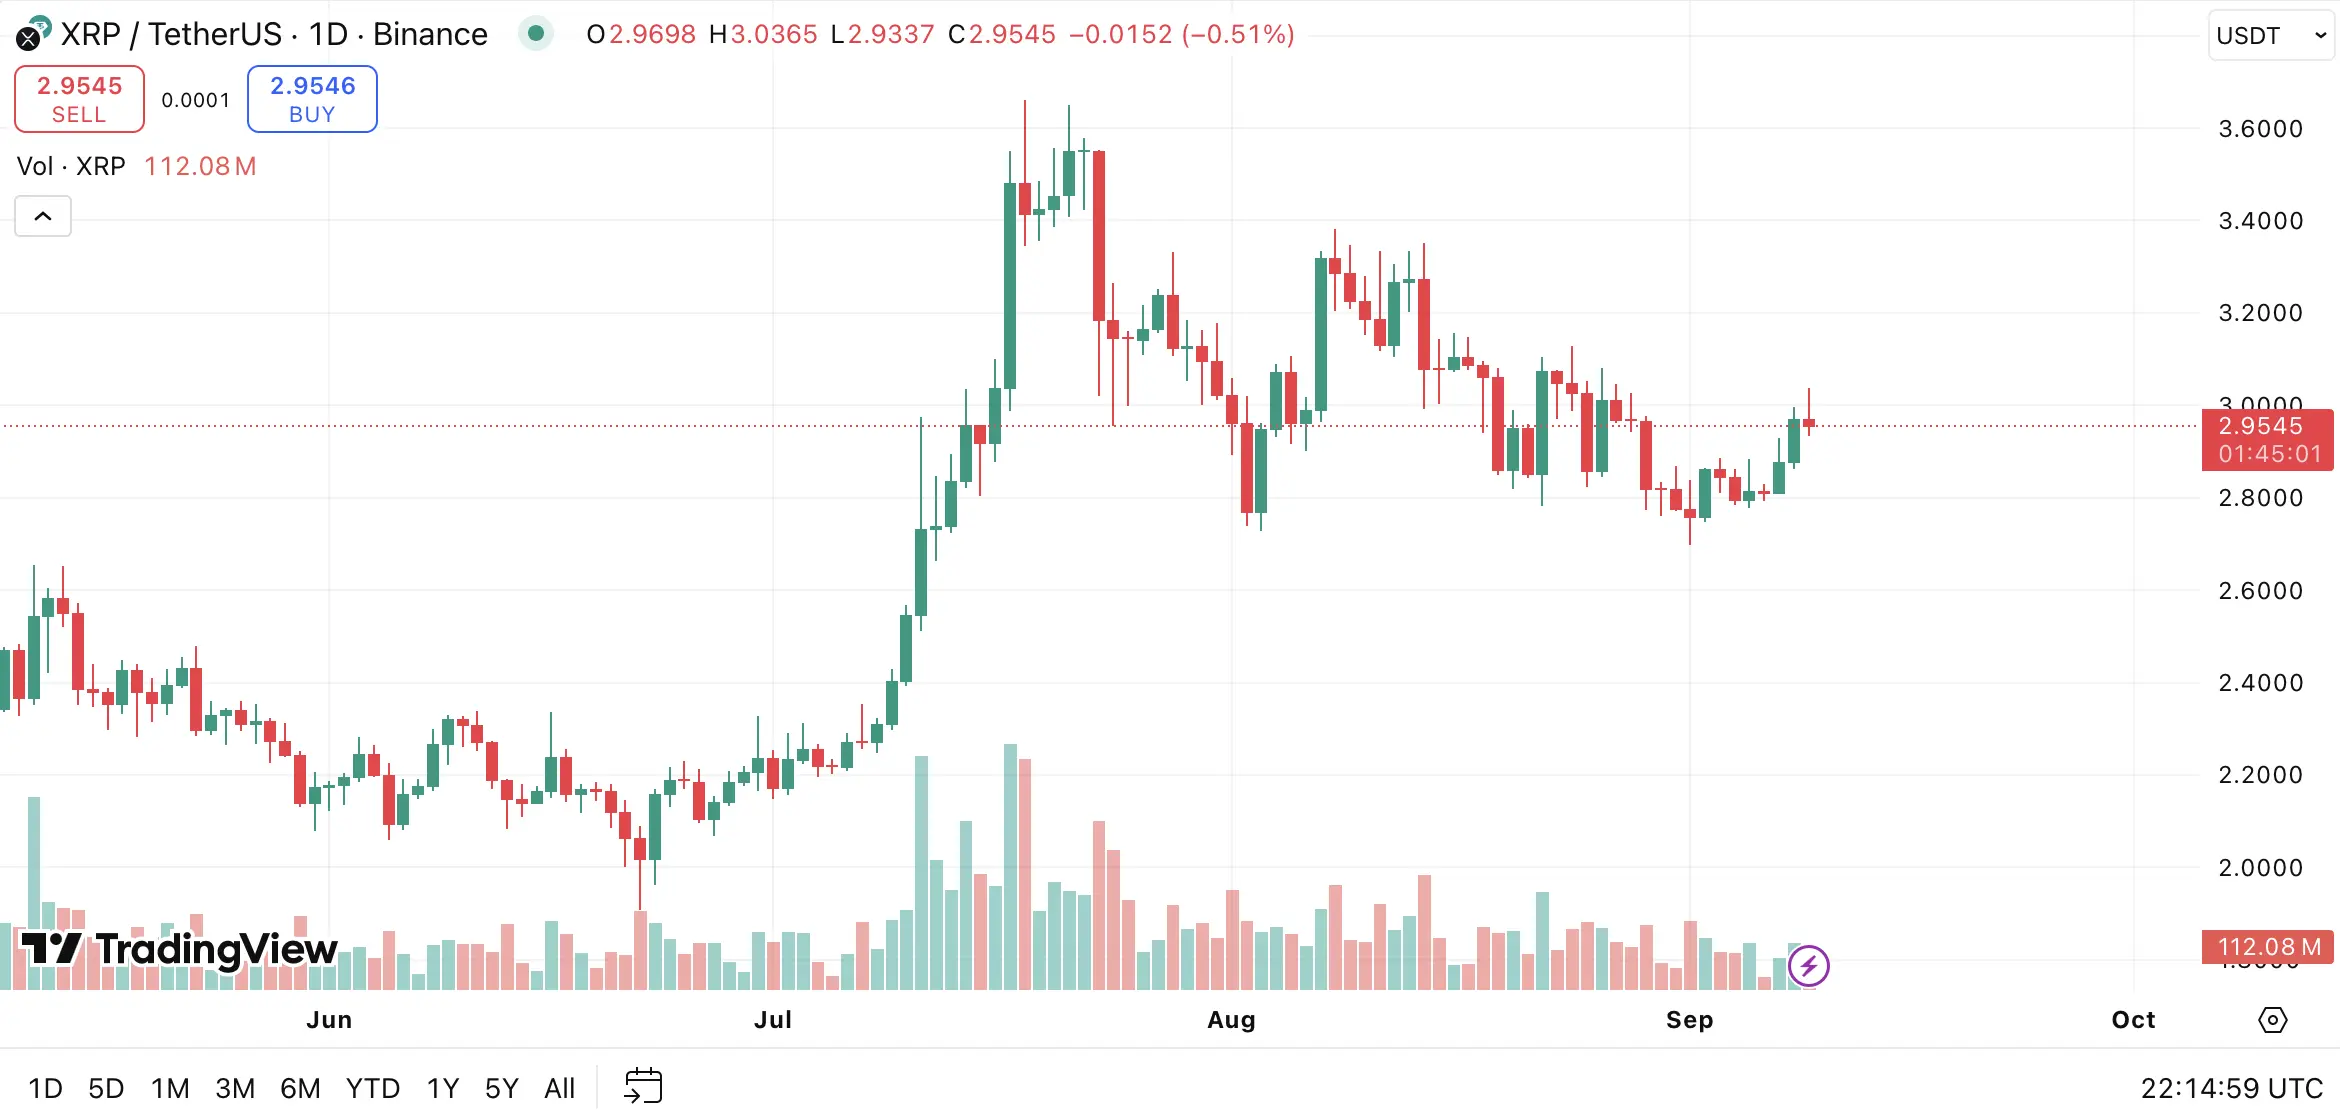
At the start of September, XRP established a double bottom pattern above $2.70, preventing a deeper correction. Early this week, the price moved back above the 20-day EMA ($2.91) and 50-day EMA ($2.91), clearing its first significant hurdle. The market has since pushed into the heavy resistance cluster between $3.00 and $3.07, which combines horizontal resistance, a descending trendline, and the 38.2% Fibonacci retracement.
A decisive break above $3.07 could open the way to $3.13 in the near term. If bulls fail to secure this level, they will need to defend the EMA confluence as support. A drop back under $2.70 would expose the next bearish target in the orange support zone.
Bullish targets: $3.00–3.07, $3.13, $3.30–3.38, $3.45, $3.55–3.66, $3.92, $4.25, $4.50–4.67.
Bearish targets: $2.91, $2.77–2.70, $2.58–2.53, $2.43, $2.33–2.26, $2.17, $2.08–1.96.
Investor sentiment toward XRP has strengthened in recent days, fueled by speculation around a potential SEC approval of Ripple Spot ETFs. Such an event could significantly boost market demand. Should buyers manage to lift the price firmly above $3.07, a rally toward $3.13 appears likely — a level that held technical importance multiple times last month and aligns with the current Supertrend.
Sustained momentum could then carry XRP into the $3.30–3.38 zone, the last major barrier before challenging July’s all-time high. A confirmed breakout there would raise the probability of an advance toward $3.45, then $3.55–3.66, and possibly $3.92. Holding above this level would further support a run toward $4.25 (161.8% Fibonacci extension), with the maximum upside for the coming months seen between $4.50 and $4.67.
On the flip side, sellers were unable to force a move below the 200-day EMA ($2.70 support) earlier this month. For bears to regain control, XRP must slide back under $2.91. A sustained breakdown below $2.70 would point to the $2.58–2.53 zone as the next correction target. If selling pressure intensifies, the decline could extend toward $2.43 or even $2.26. Remaining capped below the 200-day EMA would keep the bearish outlook alive, with potential downside toward $2.17 or $1.96.
Technical Indicators
The RSI has rebounded toward the upper edge of the neutral band. A continuation higher would activate a fresh buy signal and leave room for further gains. On the weekly timeframe, RSI also appears to defend its bullish setup, underlining the positive bias for Ripple in the medium term.