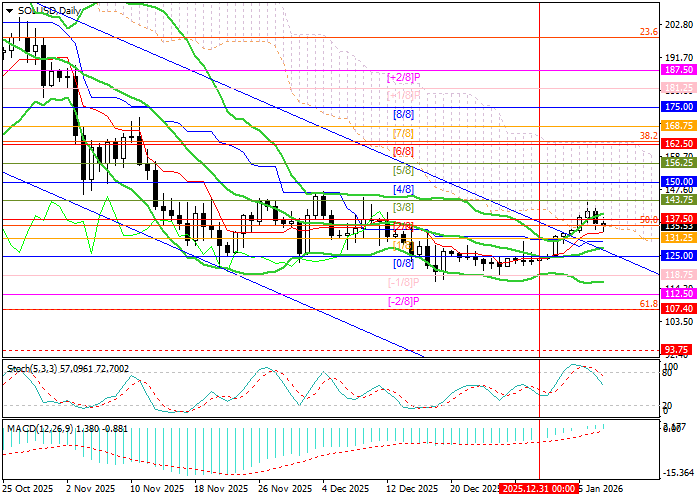
Over the past four months, the SOL/USD pair has been steadily losing value, forming a clear descending channel. However, in early January the quotes resumed an upward move in line with the broader market trend, exited this channel by breaking above its upper boundary, and reached the 143.75 level (Murray level [3/8]). Despite this, the price failed to consolidate above it, and over the last two sessions a renewed decline has been observed. At present, the instrument is in a state of uncertainty: a breakout above 143.75 would accelerate the move toward the targets at 162.50 (Murray level [6/8], Fibonacci retracement 38.2%) and 175.00 (Murray level [8/8]). The key level for bears is seen at 125.00 (Murray level [0/8], middle Bollinger Band); a downside breakout there would likely lead to a return into the descending channel and a test of the levels at 107.40 (Fibonacci retracement 61.8%) and 93.75 (Murray level [3/8], W1).
Technical indicators do not provide a clear signal: the Bollinger Bands are turning upward, the MACD histogram is increasing in the positive zone, while the Stochastic Oscillator is leaving the overbought area. It is also worth noting that on the weekly chart the medium-term downtrend remains intact, pointing to the continued relevance of the bearish scenario, although the corrective potential toward 175.00 (the middle Bollinger Band on W1) has not yet been fully exhausted.
Support and resistance levels
Resistance levels: 143.75, 162.50, 175.00.
Support levels: 125.00, 107.40, 93.75.
Trading scenarios and SOL/USD price forecast
Short positions can be opened below the 125.00 level with targets at 107.40 and 93.75, and a stop loss at 136.00. Time horizon: 5–7 days.
Long positions can be opened above the 143.75 level with targets at 162.50 and 175.00, and a stop loss at 127.00.
Scenario
| Timeframe |
Weekly |
| Recommendation |
SELL STOP |
| Entry point |
124.60 |
| Take Profit |
107.40, 93.75 |
| Stop Loss |
136.00 |
| Key levels |
93.75, 107.40, 125.00, 143.75, 162.50, 175.00 |
Alternative scenario
| Recommendation |
BUY STOP |
| Entry point |
144.30 |
| Take Profit |
162.50, 175.00 |
| Stop Loss |
127.00 |
| Key levels |
93.75, 107.40, 125.00, 143.75, 162.50, 175.00 |
Cryptocurrency journalist and market analyst with extensive industry experience. Shares practical insights for traders and investors, focusing on Web3, DeFi, smart contracts, NFTs, RWAs, and AI–blockchain integration. Contributor to FORECK.INFO, CoinGape, CryptoNews, and Business2Community.