

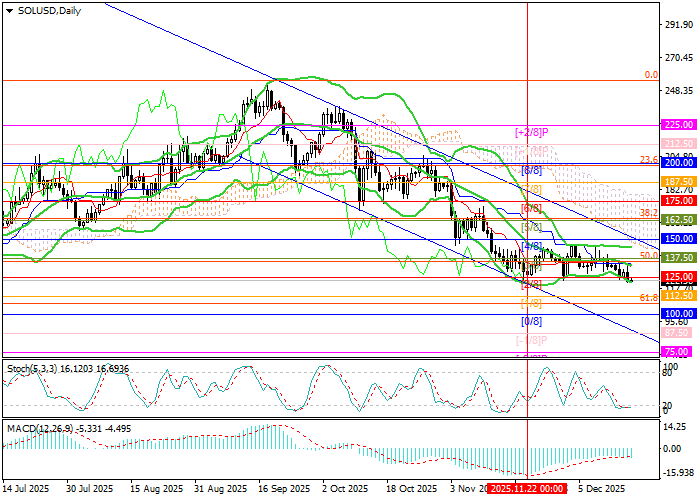
Technical indicators do not provide a clear signal: Bollinger Bands are moving sideways, as is the Stochastic oscillator, while the MACD remains stable in negative territory.
It is also worth noting that on the weekly chart, prices continue to show signs of forming a “double top” pattern, confirming the potential for further downside movement at least toward the 93.75 level (Murray level [3/8], W1).
Support and resistance levels
Resistance levels: 150.00, 187.50, 200.00.
Support levels: 125.00, 100.00, 75.00.
Trading scenarios and SOL/USD forecast
Short positions can be opened from the 121.00 level with targets at 100.00 and 75.00, and a stop-loss at 139.00. Time horizon: 5–7 days.
Long positions can be opened above the 150.00 level with targets at 187.50 and 200.00, and a stop-loss at 130.00.
Scenario
| Timeframe | Weekly |
| Recommendation | SELL STOP |
| Entry point | 121.00 |
| Take Profit | 100.00, 75.00 |
| Stop Loss | 139.00 |
| Key levels | 75.00, 100.00, 125.00, 150.00, 187.50, 200.00 |
Alternative scenario
| Recommendation | BUY STOP |
| Entry point | 151.00 |
| Take Profit | 187.50, 200.00 |
| Stop Loss | 130.00 |
| Key levels | 75.00, 100.00, 125.00, 150.00, 187.50, 200.00 |
