

Technical indicators remain mixed: Bollinger Bands are turning upward, MACD is preparing to enter the negative zone, while Stochastic may soon exit oversold territory.
On the weekly chart, the long-term uptrend remains intact, limiting the correction potential to around 183.80 (midline of the Bollinger Bands, W1).
Support and Resistance Levels
Resistance: 227.50, 250.00, 265.62.
Support: 203.12, 183.80, 171.88.
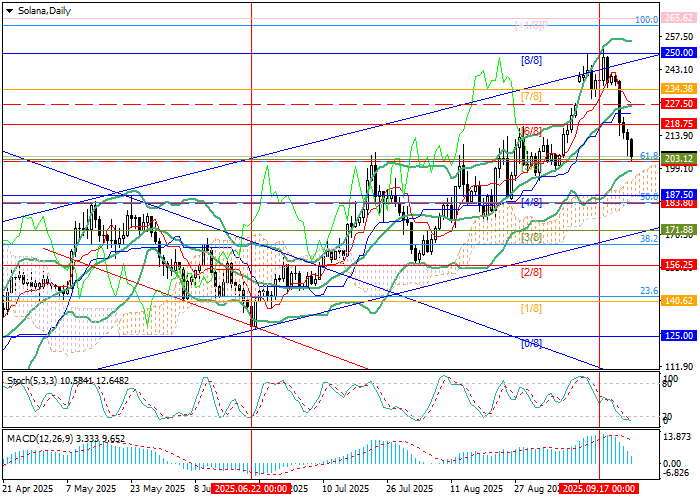
Trading Scenarios and Forecast for Solana (SOL/USD)
Short positions can be considered below 203.12 with targets at 183.80 and 171.88, stop-loss at 216.80. Timeframe: 5–7 days.
Long positions are relevant above 227.50 with targets at 250.00 and 265.62, stop-loss at 212.00.
Scenario
| Timeframe | Weekly |
| Recommendation | SELL |
| Entry Point | 202.74 |
| Take Profit | 183.80, 171.88 |
| Stop Loss | 216.80 |
| Key Levels | 171.88, 183.80, 203.12, 227.50, 250.00, 265.62 |
Alternative Scenario
| Recommendation | BUY STOP |
| Entry Point | 227.55 |
| Take Profit | 250.00, 265.62 |
| Stop Loss | 212.00 |
| Key Levels | 171.88, 183.80, 203.12, 227.50, 250.00, 265.62 |