
In recent days, Solana and Cardano have publicly signaled readiness to discuss the creation of a direct blockchain bridge. The discussion was triggered by several posts on X, where Solana co-founder Anatoly Yakovenko openly supported interoperability, and Cardano founder Charles Hoskinson publicly backed the idea. Despite some sharp reactions from both communities, the overall tone of the exchange was unusually conciliatory.
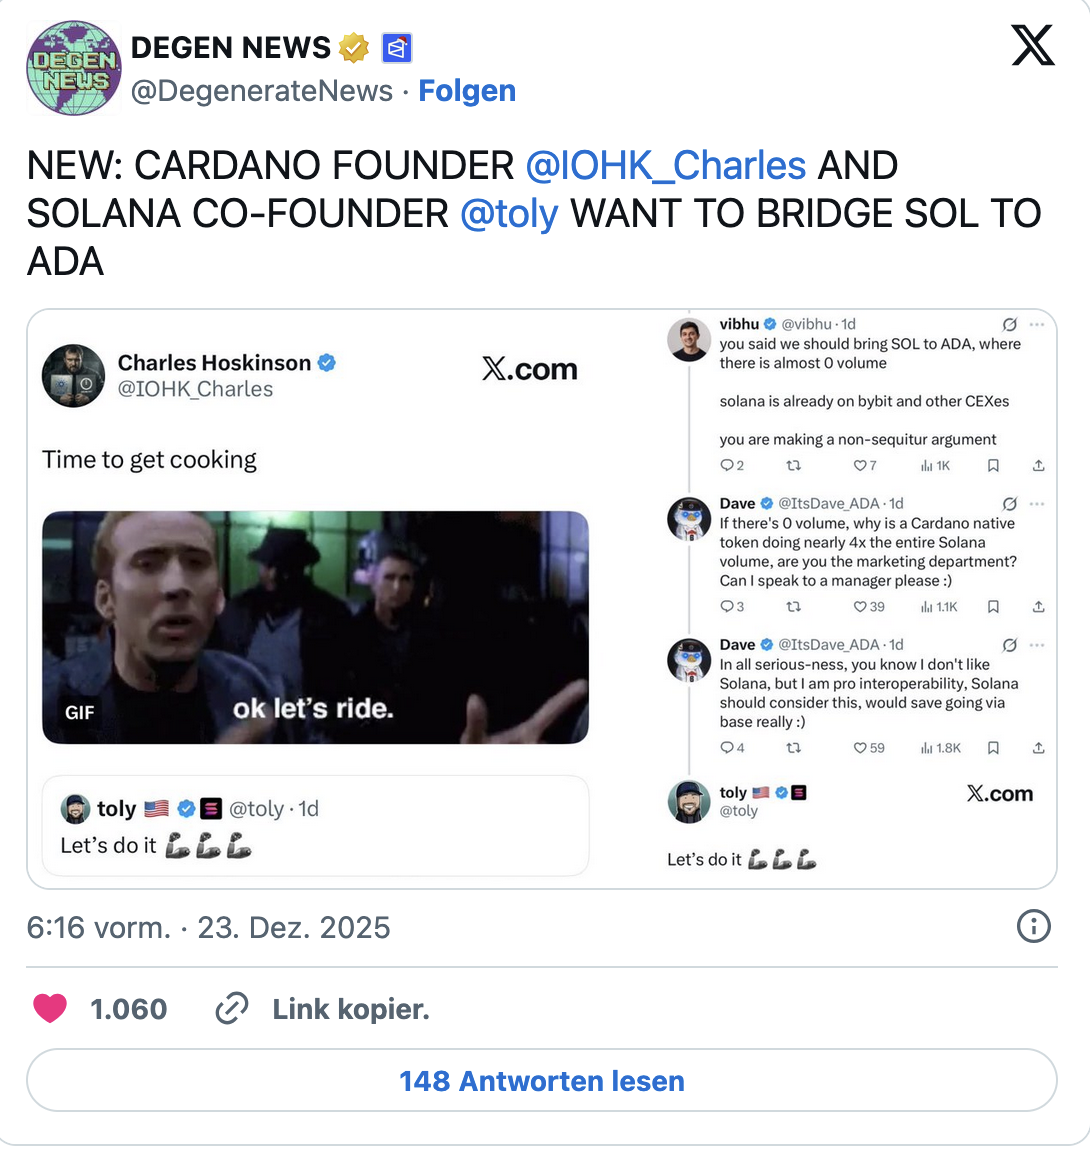
While no concrete technical details or timelines have been announced so far, the discussion itself underscores the growing importance of interoperability in the competitive landscape among Layer-1 blockchains. Solana, which traditionally emphasizes high transaction throughput and low fees, could theoretically benefit from deeper integration with other networks. However, this narrative has had little immediate impact on price action.
The technical picture remains strained
Over the past 12–24 hours, Solana has shown clear weakness. Price action has unfolded within a range between $125.65 on the upper boundary and $120.63 on the lower boundary, based on the last six four-hour candles. The current price is around $121.49, roughly 2.2% lower than a day earlier. Market capitalization is estimated at approximately $68.2 billion.
From a technical perspective, conditions remain unfavorable. Solana is trading below the 20-period EMA, currently near $124.60, and continues to form a sequence of lower highs and lower lows in the short term. This structure points to sustained selling pressure.
On the downside, the $120.63 area acts as the key support zone. A breakdown below this level would shift market focus toward $116.88, derived from the broader downtrend and Fibonacci levels. On the upside, near-term resistance is located at the 20 EMA and at the recent local high of $125.65. As long as Solana remains below the 20 EMA, the short-term market bias stays bearish.
Solana momentum
Momentum indicators also offer little encouragement. The RSI is hovering around 38, near the lower end of its range, signaling weakening buying interest without yet showing clear oversold conditions. At the same time, the MACD histogram remains negative, pointing to strengthening downside momentum.
Volatility remains elevated. The Bollinger Bands currently span a range of roughly $5.8. Price is holding below the lower band, indicating a tense consolidation phase and raising the likelihood of continued short-term swings.
Short-term outlook
|
Scenario |
Target range (USD) |
Probability |
Invalidation level |
Key levels |
Triggers |
|---|---|---|---|---|---|
|
Neutral |
$121.49 – $125.00 |
40% |
$116.88 |
Support: $120.63 (latest low). |
RSI stabilizes above 35. |
|
Bullish |
$125.65 – $131.24 |
25% |
$124.00 |
EMA-20: $124.60. |
Sustained close above EMA-20 ($124.60). |
|
Bearish |
$116.88 – $110.00 |
35% |
$125.65 |
Support: $116.88 (Fibonacci terminal level, downtrend). |
In the short term, the outlook for Solana remains negative. As long as price stays below the 20 EMA, risks remain skewed toward further downside. A sustained break below $120.63 would intensify selling pressure and open the path toward $116.88.
Only a recovery and firm consolidation above the $124.60 area, combined with a confirmed breakout above $125.65, would materially improve the technical picture and create room for a technical rebound toward the $131 zone.
