

Just ahead of the Chinese New Year, management unveiled a new artificial intelligence model, Qwen 3.5, which the company says significantly outperforms U.S. peers while maintaining low operating costs. The model features 397.0 billion parameters, with only 17.0 billion activated per query, allowing an eightfold increase in computational efficiency and roughly a 60% reduction in processing costs compared with earlier versions. The neural network is capable of autonomously executing multi-task operations within applications without direct human involvement, outperforming competitors such as ChatGPT 5.2, Claude Opus 4.5, and Google Gemini 3 Pro in text comprehension, multimodal analysis, and autonomous task execution. Alibaba is aiming to attract as many users as possible to the service in China, where it faces intense competition from DeepSeek and ByteDance’s Doubao platform, which recently launched Doubao 2.0—the largest AI service by user count in the country.
The company’s financial results are due later today. Revenue is expected to reach CNY 291.16 billion, up from CNY 247.8 billion in the previous quarter and CNY 280.15 billion a year earlier. Earnings per share are projected at CNY 12.51, compared with CNY 4.36 in the prior quarter and CNY 21.39 a year ago. Alibaba last paid a special dividend of CNY 1.98 per share on July 10 last year, delivering an annualized yield of 1.66%, well above the sector average of around 0.60%.
Support and resistance levels
On the daily chart, the instrument is retreating from the upper boundary of a local descending channel with dynamic limits at 175.00–138.00.
Technical indicators are set to reinforce a stable sell signal: the range of the Alligator EMA indicator is widening, while the Awesome Oscillator histogram is forming declining bars in negative territory.
Resistance levels: 166.30, 189.40.
Support levels: 145.90, 122.80.
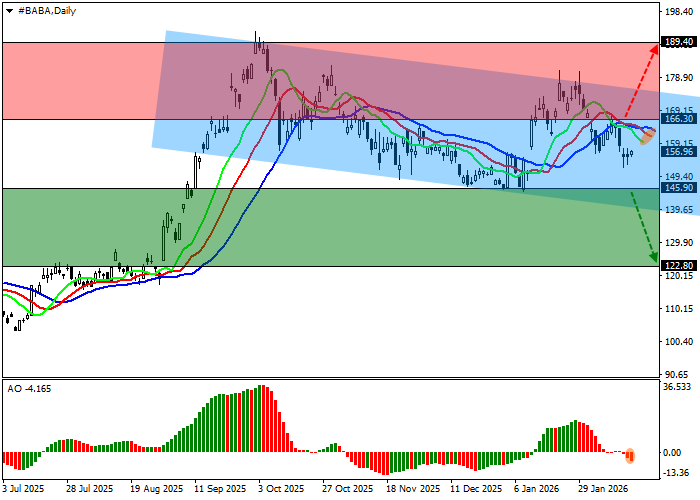
Trading scenarios and Alibaba share price outlook
Short positions can be considered after a decline and consolidation below 145.90, with a target at 122.80 and a stop loss at 155.00. Time horizon: 7 days or longer.
Long positions can be considered after a rise and consolidation above 166.30, with a target at 189.40. Stop loss above the current price level of 157.00.
Scenario
| Timeframe | Weekly |
| Recommendation | SELL STOP |
| Entry point | 145.85 |
| Take Profit | 122.80 |
| Stop Loss | 155.00 |
| Key levels | 122.80, 145.90, 166.30, 189.40 |
Alternative scenario
| Recommendation | BUY STOP |
| Entry point | 166.35 |
| Take Profit | 189.40 |
| Stop Loss | 157.00 |
| Key levels | 122.80, 145.90, 166.30, 189.40 |
