

The key level for buyers is seen at 1.6420 (61.8% Fibonacci retracement), reinforced by the middle line of the Bollinger Bands. A breakout above this mark would allow the pair to exit the descending channel and target 1.9531 (Murray level [6/8]) and 2.3437 (Murray level [8/8], 38.2% Fibonacci retracement).
Technical indicators confirm the continuation of the current trend: Bollinger Bands are turning downward, the MACD histogram is expanding in negative territory, and the Stochastic oscillator is approaching overbought levels and may also reverse lower.
Support and Resistance Levels
Resistance levels: 1.6420, 1.9531, 2.3437.
Support levels: 1.3671, 1.1718.
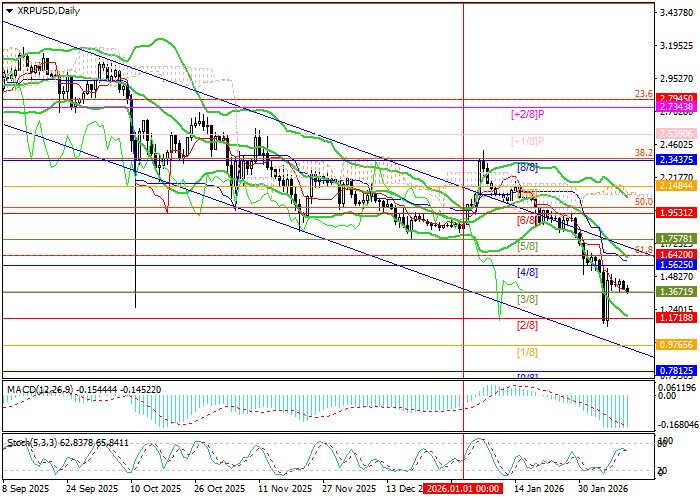
Trading Scenarios and XRP Forecast
Short positions may be considered below 1.3671 with a target at 1.1718 and a stop-loss at 1.5100. Time horizon: 5–7 days. Long positions may be considered above 1.6420 with targets at 1.9531 and 2.3437 and a stop-loss at 1.4200.
Scenario
| Timeframe | Weekly |
| Recommendation | SELL STOP |
| Entry Point | 1.3600 |
| Take Profit | 1.1718, 0.7812 |
| Stop Loss | 1.5100 |
| Key Levels | 0.7812, 1.1718, 1.3671, 1.6420, 1.9531, 2.3437 |
Alternative Scenario
| Recommendation | BUY STOP |
| Entry Point | 1.6450 |
| Take Profit | 1.9531, 2.3437 |
| Stop Loss | 1.4200 |
| Key Levels | 0.7812, 1.1718, 1.3671, 1.6420, 1.9531, 2.3437 |
