

Investors and forex traders expect monetary policy paths at the Bank of England and the U.S. Federal Reserve to diverge in the near term, putting pressure on the pound while supporting the dollar. Recent macroeconomic data give the UK regulator room to return to a more dovish stance: preliminary GDP growth in the fourth quarter came in at just 0.1% quarter-on-quarter versus expectations of 0.2%, and 1.0% year-on-year against a forecast of 1.2%. Meanwhile, unemployment rose to a ten-year high outside the COVID-19 period, reaching 5.2%. Employment growth slowed from 82.0K to 52.0K, average wage growth eased to 4.2% versus preliminary estimates of 4.6%, and pay growth excluding bonuses decelerated from 3.6% to 3.4%. At the same time, consumer price inflation is expected to fall from 0.4% to –0.5% month-on-month and from 3.4% to 3.0% year-on-year. Against this backdrop, the probability of a rate cut as early as March has risen to 90.0%, with analysts also pricing in at least one additional reduction later this year.
By contrast, Federal Reserve officials may refrain from adjusting monetary policy for an extended period, as reflected in key economic data and the minutes of the regulator’s latest meeting. January figures confirmed labor market resilience—unemployment declined to 4.3% and nonfarm payrolls increased by 130.0K—alongside easing inflation, with headline CPI slowing from 2.7% to 2.4% year-on-year and the core measure from 2.6% to 2.5%. However, inflation remains well above the Fed’s 2.0% target in several household-sensitive categories. While some policymakers expect faster productivity growth driven by technological innovation to help curb inflation, the majority fear that progress toward the target could be slower and more uneven than anticipated, with risks of inflation becoming entrenched above target still significant.
Overall, the prospect of borrowing costs being cut by the Bank of England while remaining unchanged by the Federal Reserve is likely to keep pressure on GBP/USD over the medium term.
Support and resistance levels
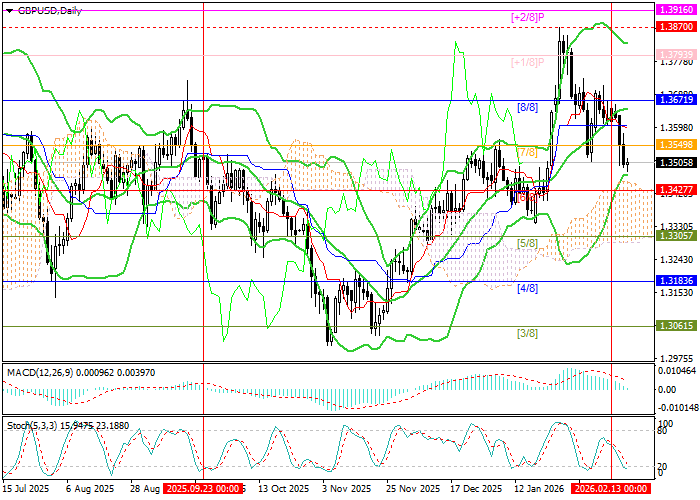
The instrument is trading near the lower Bollinger Band at 1.3427 (Murray level [6/8]). A break below this area could signal a reversal of the current upward trend and open the way toward 1.3183 (Murray level [4/8]) and 1.3061 (Murray level [3/8]). Conversely, a breakout above the middle Bollinger Band at 1.3671 (Murray level [8/8]) would likely pave the way toward 1.3870 (the January highs) and 1.3916 (Murray level [+2/8]).
Technical indicators remain mixed: Bollinger Bands are turning higher, the MACD histogram is preparing to move into negative territory and generate a sell signal, while the Stochastic has reached oversold levels and may soon reverse.
Resistance levels: 1.3671, 1.3870, 1.3916.
Support levels: 1.3427, 1.3183, 1.3061.
Trading scenarios and GBP/USD outlook
Short positions may be opened below 1.3427 with targets at 1.3183 and 1.3061 and a stop-loss at 1.3560. Time horizon: 5–7 days.
Long positions may be opened above 1.3671 with targets at 1.3870 and 1.3916 and a stop-loss at 1.3580.
Scenario
| Timeframe | Weekly |
| Recommendation | SELL STOP |
| Entry point | 1.3425 |
| Take Profit | 1.3183, 1.3061 |
| Stop Loss | 1.3560 |
| Key levels | 1.3061, 1.3183, 1.3427, 1.3671, 1.3870, 1.3916 |
Alternative scenario
| Recommendation | BUY STOP |
| Entry point | 1.3675 |
| Take Profit | 1.3870, 1.3916 |
| Stop Loss | 1.3580 |
| Key levels | 1.3061, 1.3183, 1.3427, 1.3671, 1.3870, 1.3916 |
