

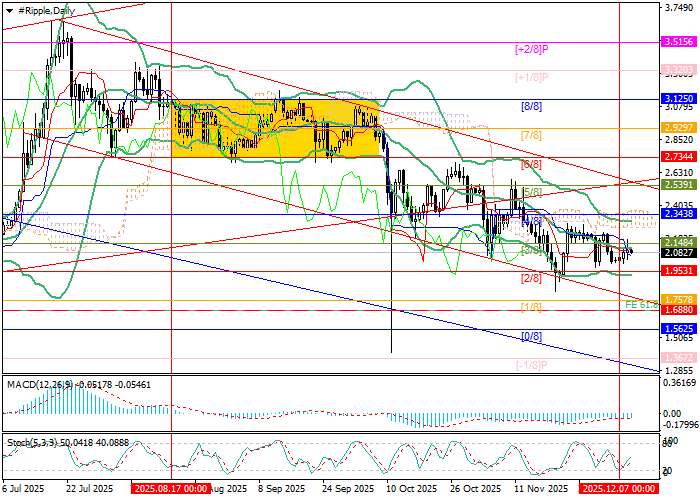
The easing of monetary policy may support an upward correction toward 2.3438 (Murray level [4/8], upper Bollinger Band) and 2.5391 (Murray level [5/8], the upper boundary of the descending channel), but is unlikely to reverse the current trend. This is confirmed by the downward turn of the Bollinger Bands and the stabilization of MACD in the negative zone. Meanwhile, the key bearish level remains 1.9531 (Murray level [2/8]); a breakout below this mark will extend the decline toward 1.6880 (61.8% Fibonacci extension) and 1.3672 (Murray level [–1/8]).
It is also worth noting that the weekly chart shows signs of a potential “double top” pattern. The price is currently located near the local low of the “trough” at 1.9531, which makes further downward movement of XRP/USD a more relevant scenario.
Support and Resistance Levels
Resistance levels: 2.1484, 2.3438, 2.5391.
Support levels: 1.9531, 1.6880, 1.3672.
XRP/USD Trading Scenarios and Forecast
Short positions should be opened below 1.9531, or after a reversal near 2.5391, with targets at 1.6880 and 1.3672, and stop-loss orders at 2.0900 and 2.6800, respectively. Estimated timeframe: 5–7 days.
Scenario
| Timeframe | Weekly |
| Recommendation | SELL STOP |
| Entry Point | 1.9520 |
| Take Profit | 1.6880, 1.3672 |
| Stop Loss | 2.0900 |
| Key Levels | 1.3672, 1.6880, 1.9531, 2.1484, 2.3438, 2.5391 |
Alternative Scenario
| Recommendation | SELL LIMIT |
| Entry Point | 2.5391 |
| Take Profit | 1.6880, 1.3672 |
| Stop Loss | 2.6800 |
| Key Levels | 1.3672, 1.6880, 1.9531, 2.1484, 2.3438, 2.5391 |
