

Investors reacted to U.S. President Donald Trump’s statement about imposing additional tariffs on all Chinese imports — a move that could effectively halt trade between the world’s two largest economies and trigger a global downturn. As a result, traders moved away from risk assets, including cryptocurrencies, liquidating over $16.0 billion in long positions. Although prices managed to recover part of the losses, the lack of progress in U.S.–China relations reignited selling pressure.
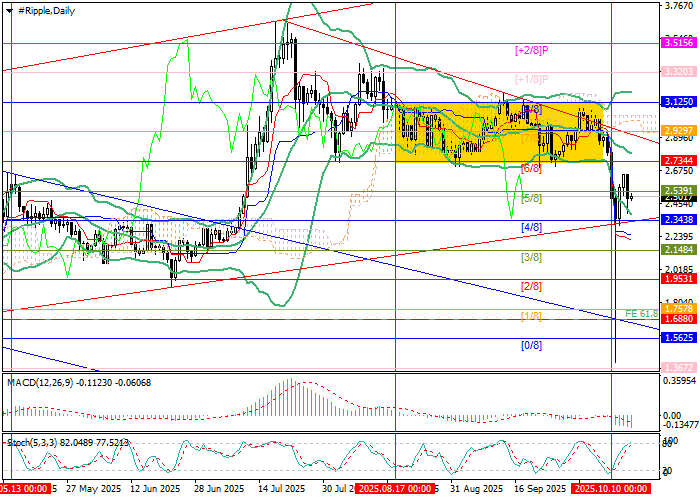
For bears, the key level remains 2.3438 (Murray level [4/8]): a firm breakdown below it will confirm the continuation of the downward trend toward targets at 1.9531 (Murray level [2/8]) and 1.5625 (Murray level [0/8]). Conversely, if the price breaks above 2.7344 (Murray level [6/8]) supported by the middle Bollinger Band, an upward move toward 3.1250 (Murray level [8/8]) and 3.5156 (Murray level [+2/8]) becomes likely.
Technical indicators confirm a bearish bias: Bollinger Bands are turning downward, MACD is expanding in the negative zone, and Stochastic, though pointing up, is already in the overbought area, suggesting a possible reversal.
Support and Resistance Levels
Resistance levels: 2.7344, 3.1250, 3.5156.
Support levels: 2.3438, 1.9531, 1.5625.
Ripple Price Forecast and Trading Scenarios
Short positions are recommended below 2.3438 with targets at 1.9531 and 1.5625, and a stop loss at 2.6500. Estimated duration: 5–7 days.
Long positions can be considered above 2.7344 with targets at 3.1250 and 3.5156, and a stop loss at 2.4500.
Scenario
| Timeframe | Weekly |
| Recommendation | SELL STOP |
| Entry Point | 2.3200 |
| Take Profit | 1.9531, 1.5625 |
| Stop Loss | 2.6500 |
| Key Levels | 1.5625, 1.9531, 2.3438, 2.7344, 3.1250, 3.5156 |
Alternative Scenario
| Recommendation | BUY STOP |
| Entry Point | 2.7700 |
| Take Profit | 3.1250, 3.5156 |
| Stop Loss | 2.4500 |
| Key Levels | 1.5625, 1.9531, 2.3438, 2.7344, 3.1250, 3.5156 |