
Bitcoin’s market is entering a critical phase, with mounting liquidity near both current prices and higher ranges, foreshadowing a potential volatility spike. According to CoinGlass, order books are stacking significant buy and sell liquidity close to $107,000 and as high as $111,000, while downside support forms just under $105,000. Such patterns historically precede powerful “liquidity grabs,” where forced liquidations amplify price swings.
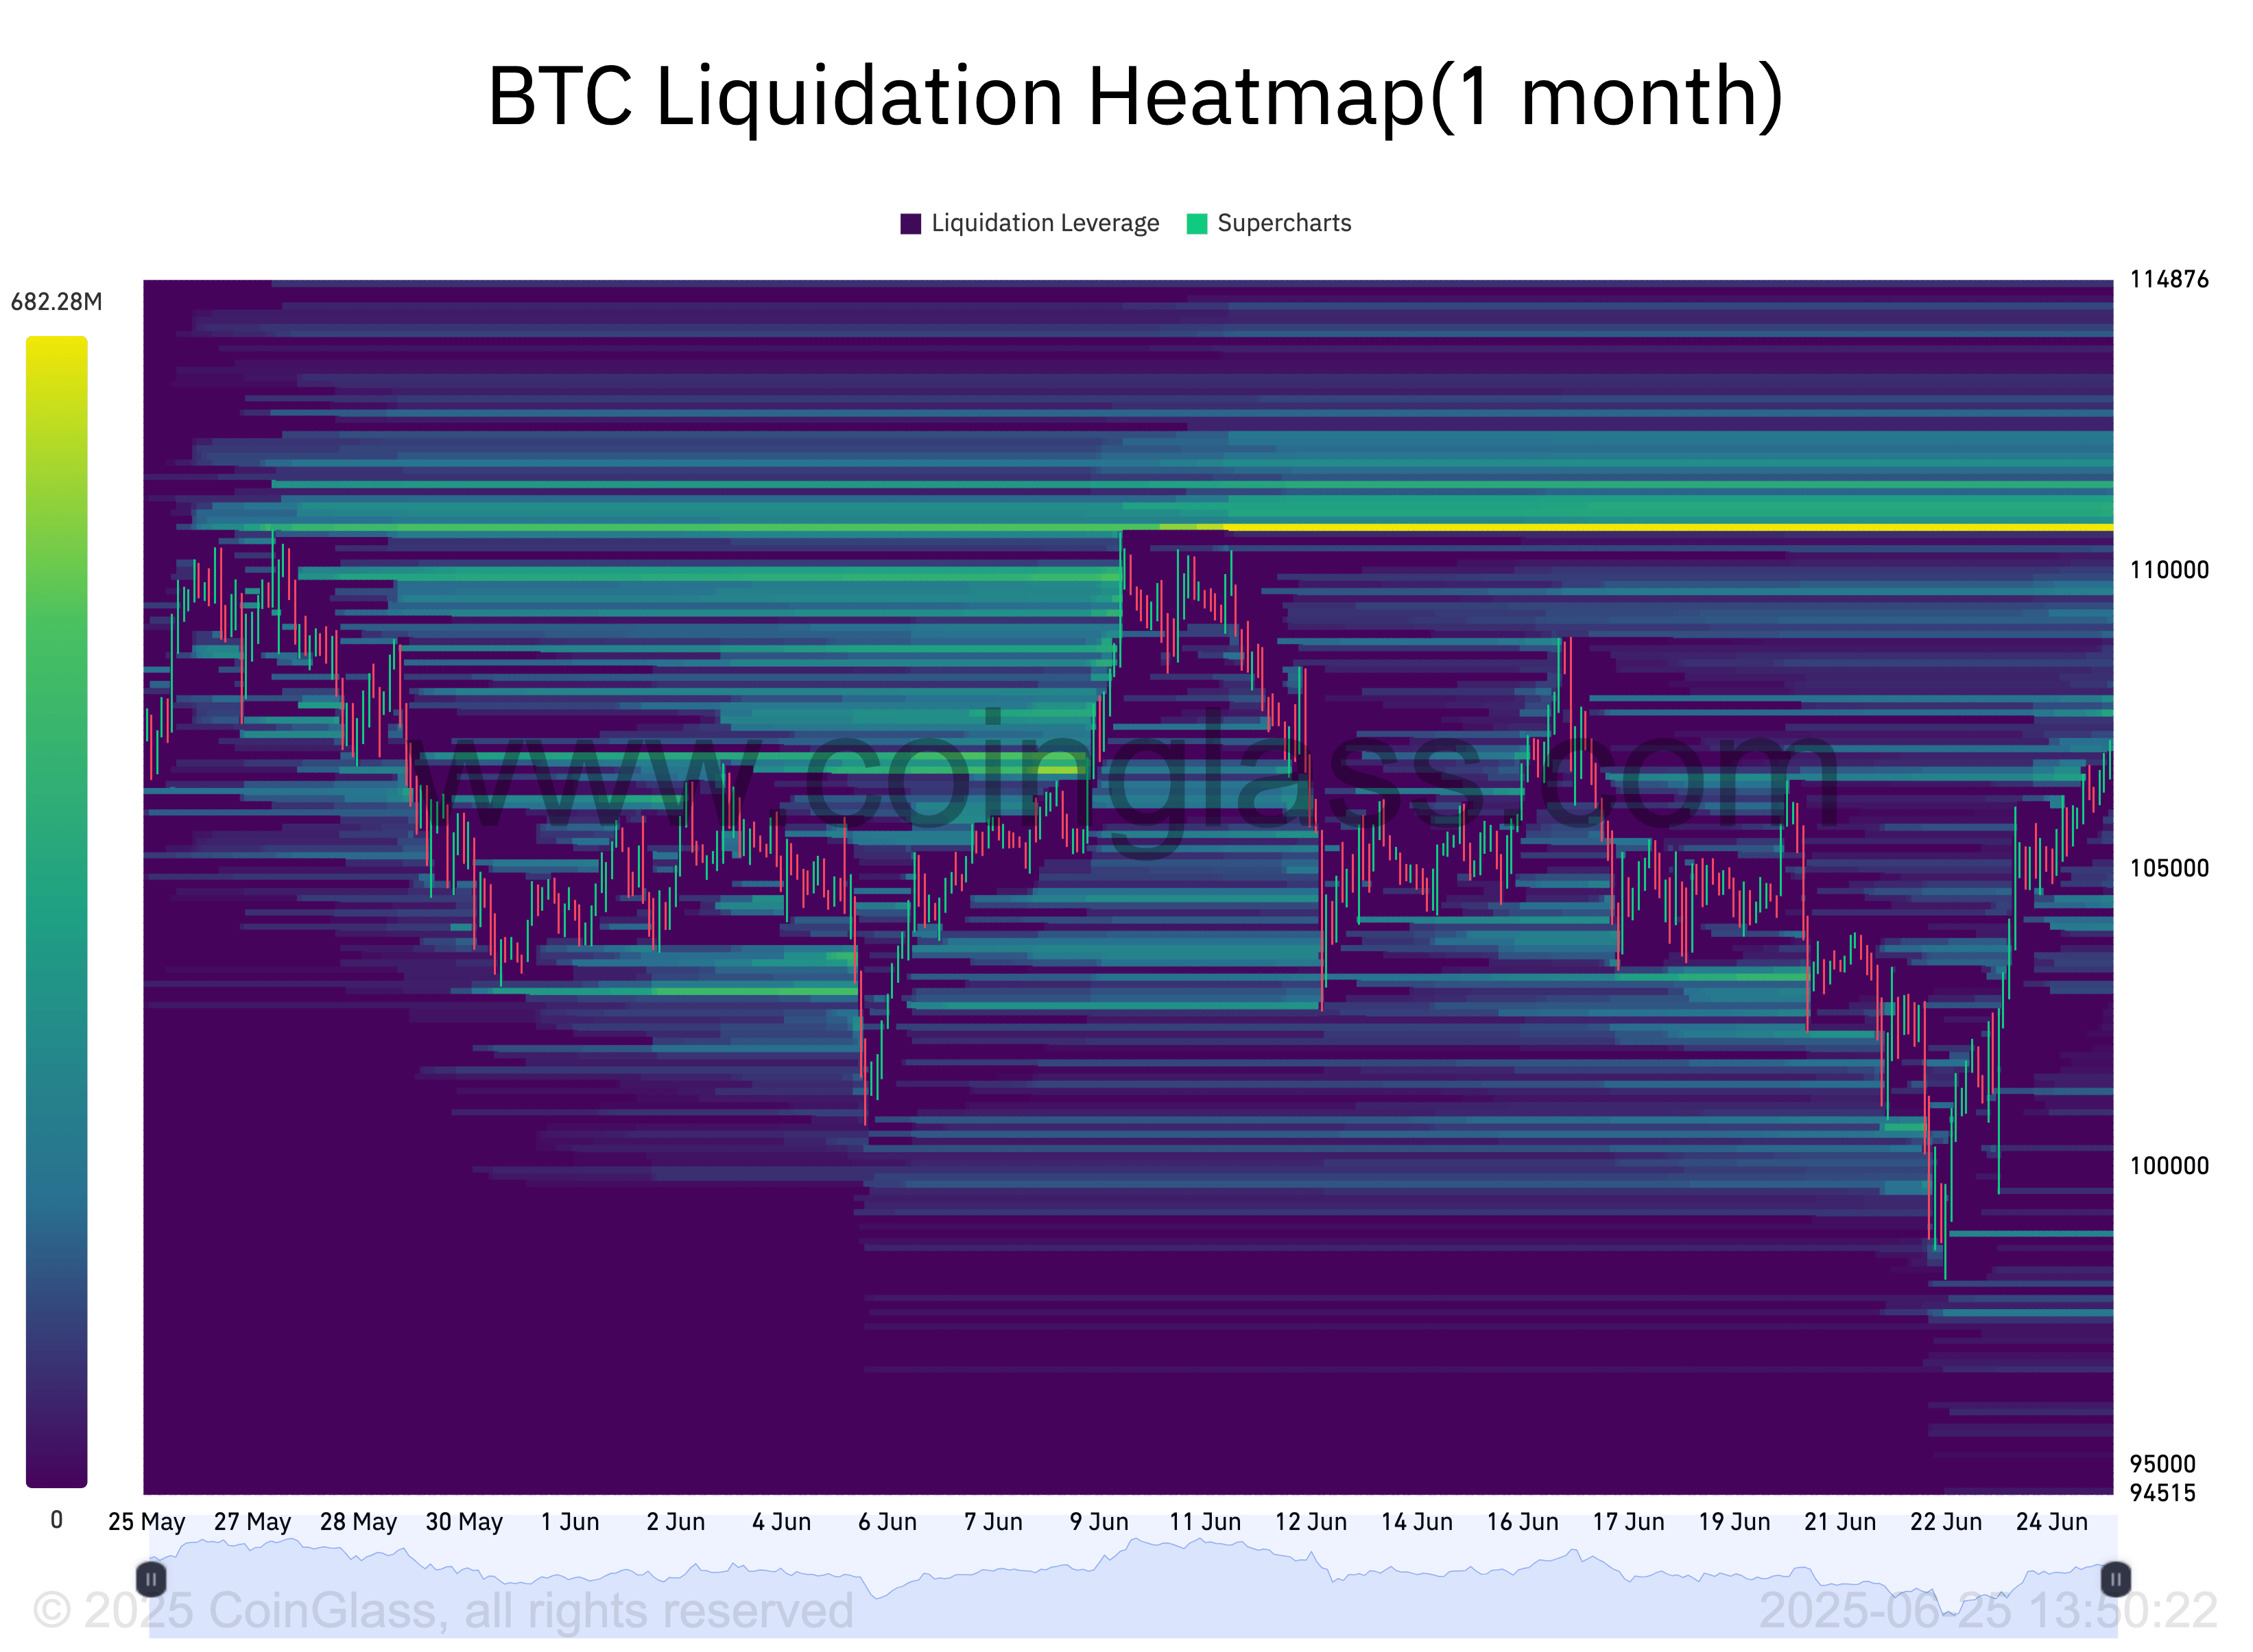 CoinGlass monthly BTC liquidation map — critical levels $103K and $111K
Consolidation and Positioning: Bulls vs Bears
After rebounding sharply from local lows on news of a Middle East ceasefire, BTC has maintained the crucial $105,000 level. As price volatility contracts, both bulls and bears are aggressively positioning for the next move. Technical analysts highlight the $107,000–$111,000 range as the battleground for upward liquidity runs, while $103,000–$105,000 is emerging as a defensive zone for bears.
“It wouldn’t surprise me to see BTC briefly pierce $107K, then sweep liquidity under $105–104K before reversing,” notes trader Mark Cullen, referencing CoinGlass’s dense liquidation heatmaps. Fellow analyst Jelle points to growing liquidity at the $109,000–$111,000 highs, arguing that the market “wants to target those stops.” Skew, another prominent strategist, identifies $103,000 as the key level to watch for downside liquidity grabs if support falters.
Macro Events, Monthly Close, and Volatility Triggers
All eyes are now on the upcoming US macro data releases — particularly the PCE index and the Federal Reserve’s meeting — which are expected to inject further volatility as the monthly candle closes. Bitcoin is currently up 1.7% for June, and the monthly close near or above $102,400 is a critical signal: “A monthly close above $102,400 confirms a bullish breakout from the range,” notes analyst Rekt Capital.
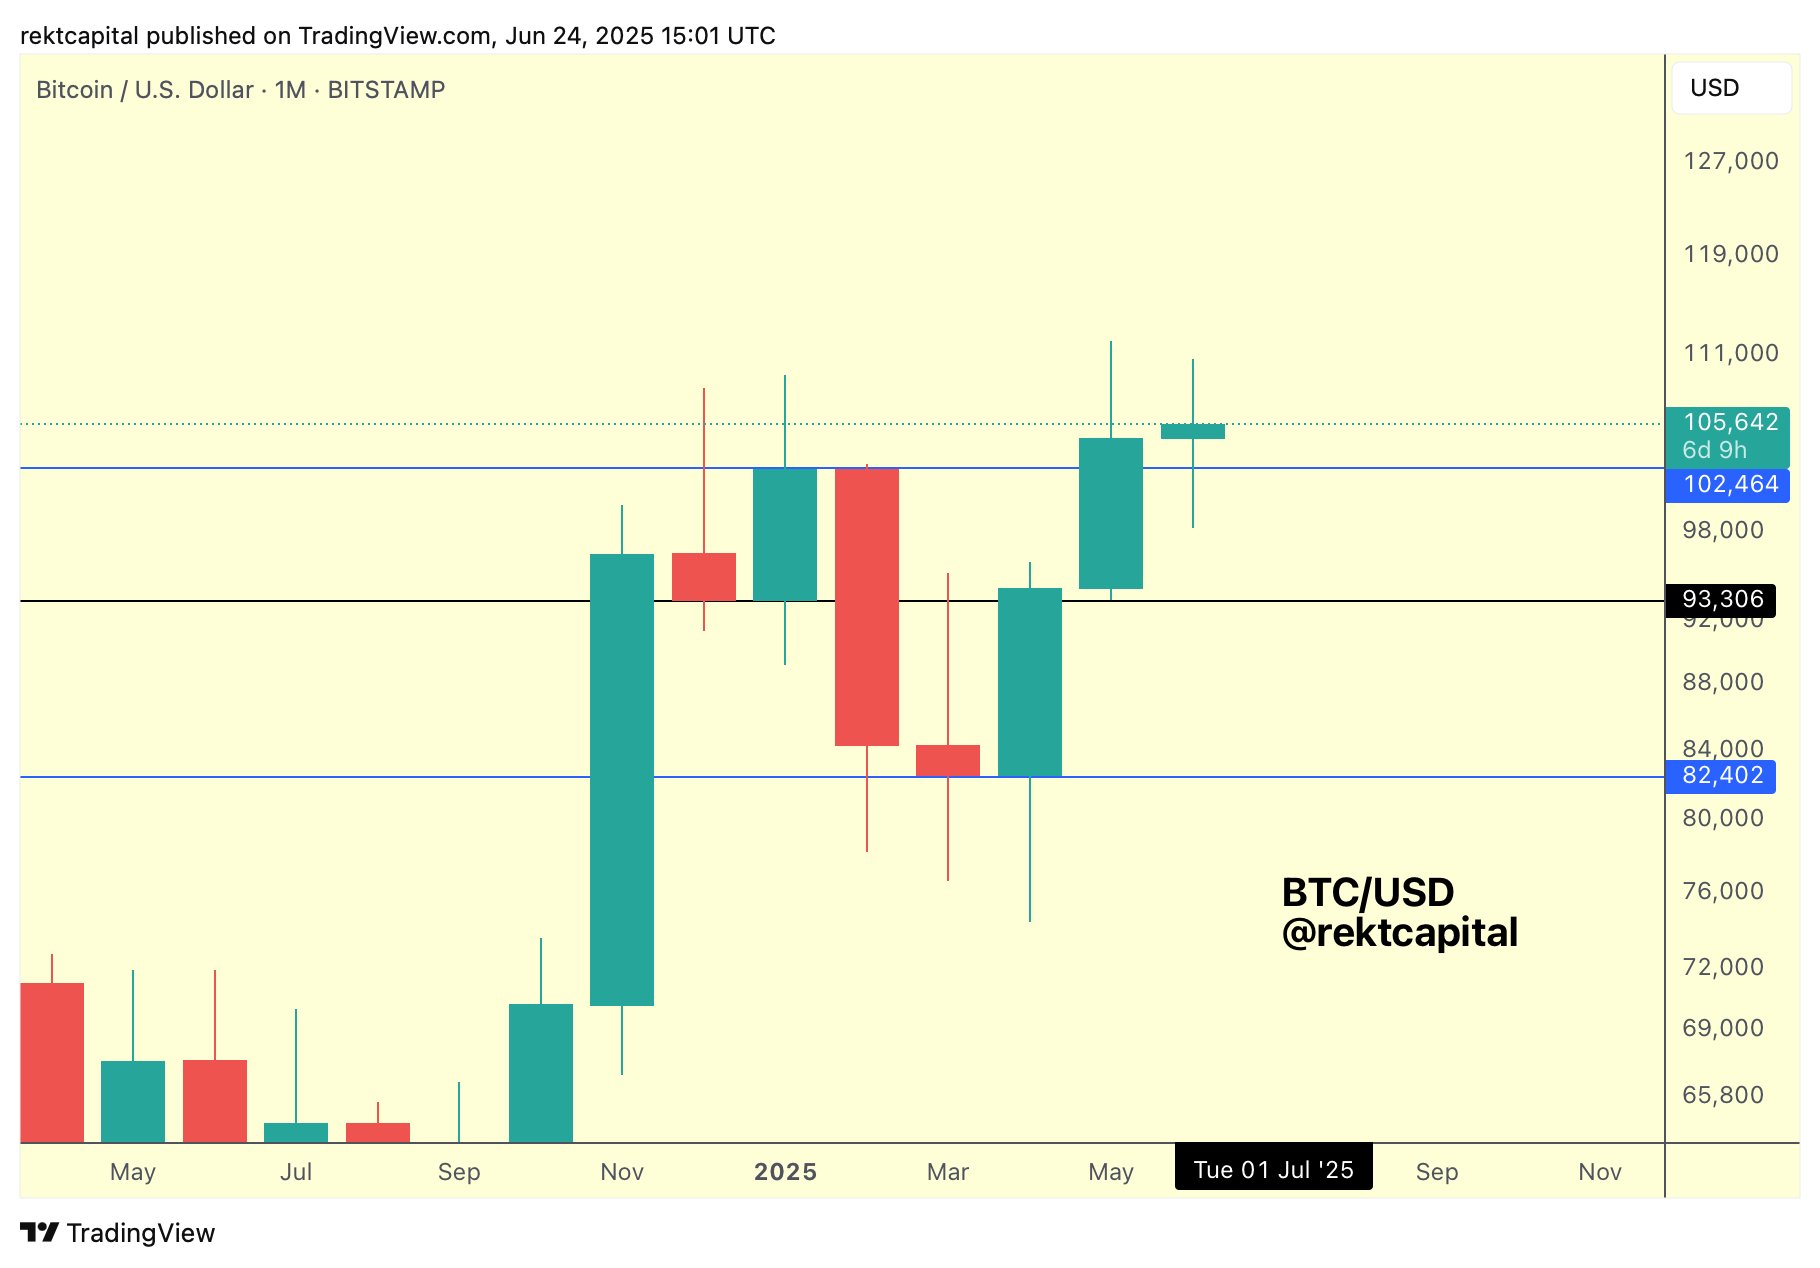 BTC/USD monthly chart: Key support and resistance levels for bulls and bears
High Volatility Ahead: What to Watch
The immediate battle is over liquidity: Should BTC break above $108,000 and then $111,000, a powerful short squeeze could unfold. Conversely, failure to hold $105,000 opens the door to a deeper correction toward $103,000 or below. Both long and short positions are stacking, and the reaction to macro events will likely dictate the market’s next major trend.
Traders should prepare for high volatility and rapid moves as the fight for liquidity intensifies. The coming days could be decisive for both bulls and bears, with the outcome shaped by technical breaks and the impact of macroeconomic headlines.