

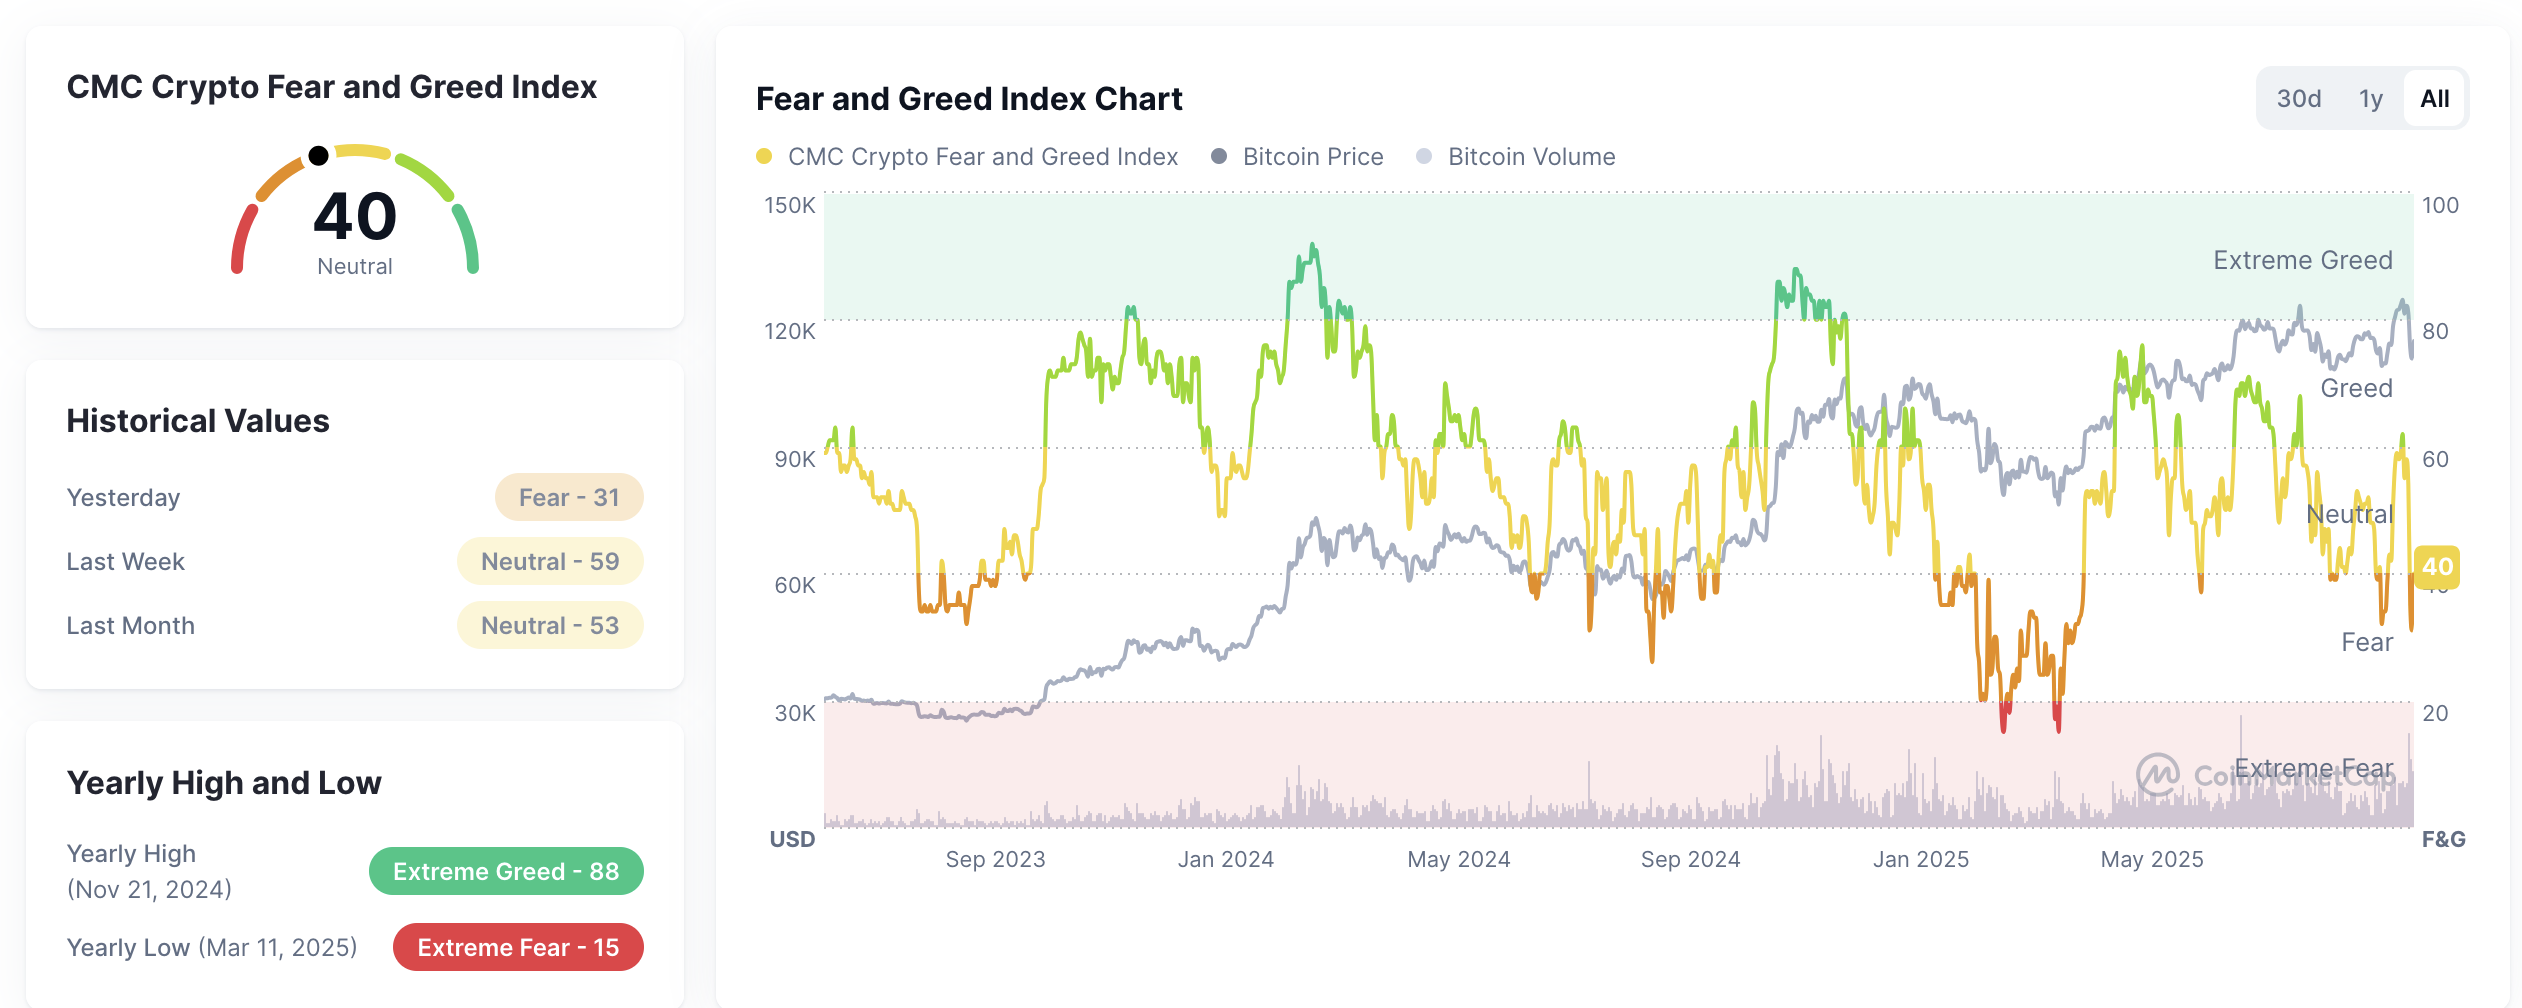
However, the most significant decline occurred over the weekend, when the price suddenly fell to the June low around 102,100.00, triggering liquidations of long positions worth approximately $20 billion and affecting nearly 1.6 million traders. Meanwhile, the Crypto Fear and Greed Index dropped to the “Fear” level of 27.
The main trigger behind the sharp sell-off was the escalation of trade tensions between China and the United States. Last Thursday, Chinese authorities announced tighter export controls on rare earth metals and related technologies, prohibiting citizens from participating in unauthorized mining activities abroad. These measures raised concerns over the supply of high-tech equipment, AI research, and the crypto mining industry. In response, U.S. President Donald Trump announced an additional 100% tariff on Chinese imports. Such measures could accelerate U.S. inflation, force the Fed to keep interest rates high for longer, and strengthen the dollar against alternative assets, including Bitcoin.
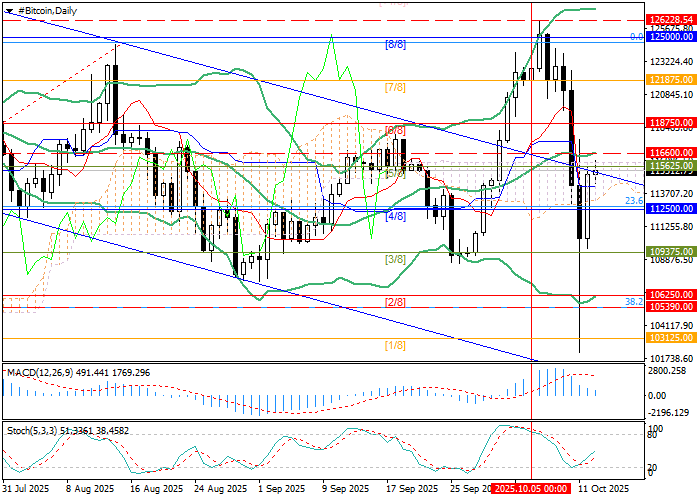
At present, the BTC/USD pair has recovered part of its losses and is now testing the 115,625.00 level (Murray [6/8]) amid softer rhetoric from both Chinese and U.S. officials. The sides are expected to seek compromise to avoid further financial damage, but until a deal is reached, the risk of another sharp market correction remains elevated.
Support and Resistance Levels
The pair briefly returned to a medium-term downtrend channel but is now attempting to break out through its upper boundary. A breakout above the middle Bollinger Band near 116,600.00 may push prices toward 121,875.00 (Murray [7/8]) and 125,000.00 (Murray [8/8]). Conversely, a drop below 112,500.00 (Murray [4/8], Fibonacci 23.6%) could trigger renewed decline toward 106,250.00 (Murray [2/8]) and 103,125.00 (Murray [1/8]).
Technical indicators remain mixed: Bollinger Bands and Stochastic are turning upward, while MACD is preparing to move into the negative zone.
Resistance levels: 116,600.00, 121,875.00, 125,000.00
Support levels: 112,500.00, 106,250.00, 103,125.00
BTC/USD Trading Scenarios and Forecast
Short positions can be opened below 112,500.00 with targets at 106,250.00 and 103,125.00, and a stop-loss at 115,700.00. Estimated duration: 5–7 days.
Long positions can be opened above 116,600.00 with targets at 121,875.00 and 125,000.00, and a stop-loss at 113,200.00.
Scenario
| Timeframe | Weekly |
| Recommendation | SELL STOP |
| Entry Point | 112,350.00 |
| Take Profit | 106,250.00, 103,125.00 |
| Stop Loss | 115,700.00 |
| Key Levels | 103,125.00, 106,250.00, 112,500.00, 116,600.00, 121,875.00, 125,000.00 |
Alternative Scenario
| Recommendation | BUY STOP |
| Entry Point | 116,800.00 |
| Take Profit | 121,875.00, 125,000.00 |
| Stop Loss | 113,200.00 |
| Key Levels | 103,125.00, 106,250.00, 112,500.00, 116,600.00, 121,875.00, 125,000.00 |