

Investors have begun rotating capital into gold-backed tokens. PAXG, which is fully backed by physical gold, has temporarily decoupled from the broader risk-off sentiment in the crypto market and assumed the role of a defensive asset.
Trading volume is particularly striking: it has surged by 302% to $1.04 billion. This signals strong buying interest and active capital rotation. If volumes remain elevated, the defensive shift toward gold-backed tokens could continue. However, the key question remains — how sustainable is the current price momentum?
PAX Gold (PAXG): price rises after US strikes on Iran
Over the past 12–24 hours, the price has fluctuated between $5,257.59 (recent candle low) and $5,600.00 (intraday high). The current closing price stands near $5,458.04, representing a gain of roughly $151.81 compared with the previous close at $5,306.23. Market capitalization is estimated at around $2.61 billion.
The price is holding firmly above the EMA-20 ($5,255.62) and has been forming a sequence of higher highs and higher lows since February 27, indicating a short-term bullish structure. Initial support lies near $5,370.08 (intraday low), followed by the EMA-20 at $5,255.62. Immediate resistance is located at $5,600.00 and the all-time high of $5,619.09. As long as the price remains above the EMA-20, the market structure stays positive to bullish.
PAX Gold in a “bullish breakout phase”
The RSI (14) stands at 68.12, signaling strong buying momentum without yet reaching extreme overbought conditions. The MACD histogram shows positive acceleration, supporting the ongoing rally. Bollinger Bands have expanded to roughly $284.39, pointing to elevated — but not yet panic-driven — volatility. Following this volatility expansion, the market has entered a bullish breakout phase with heightened tension.
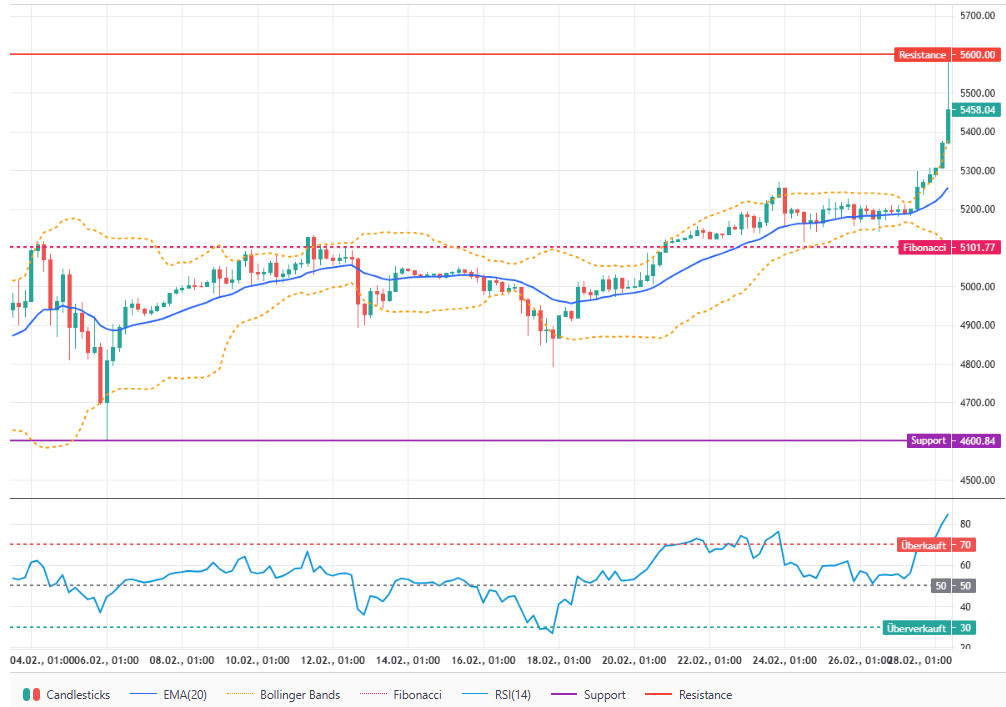
Short-term outlook: where the price could head next
The short-term outlook for PAXG on February 28, 2026 remains bullish as long as the price holds above the EMA-20 ($5,255.62). Key support levels are $5,370.08 (intraday), $5,255.62 (EMA-20), and $5,101.77 (Fibonacci level).
Resistance is located at $5,600.00 and the all-time high of $5,619.09. A sustained close above $5,600.00 accompanied by strong volume would confirm a continuation breakout. A drop below the EMA-20 would likely trigger increased volatility and a test of the Fibonacci region near $5,101.77.
