

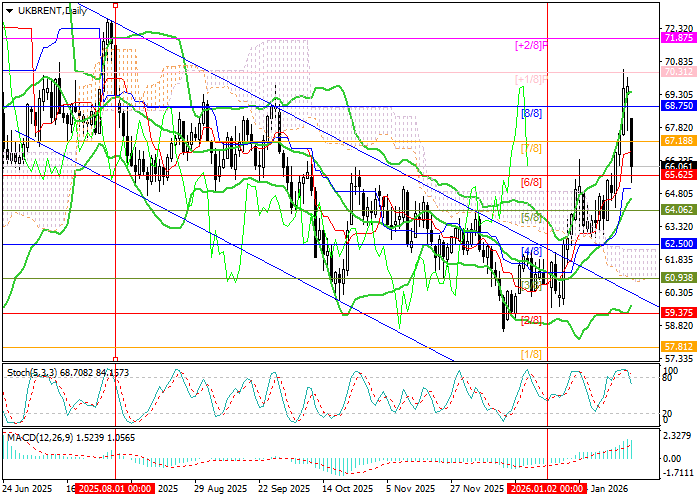
Support for the asset has been driven by fears of a potential escalation in the conflict between the United States and Iran, which could lead to a sharp reduction in global oil supply. According to expert estimates, a blockade of the Strait of Hormuz could cut Middle Eastern crude exports by as much as 20.0 million barrels per day. However, prices corrected sharply today toward 65.62 (Murray level [6/8]) following reports that Tehran and Washington have begun negotiations. Markets interpreted this as a signal of possible de-escalation, prompting a reduction in the geopolitical risk premium.
Despite the planned talks, both sides continue to prepare for potential military action. U.S. forces are being redeployed closer to Iran’s borders, while Tehran is strengthening key infrastructure, including nuclear facilities. If diplomatic efforts fail, the standoff could still move into an open confrontation.
As analysts had anticipated, Sunday’s OPEC+ meeting resulted in a decision to keep oil production levels unchanged in March. Earlier, eight countries—Saudi Arabia, Russia, the United Arab Emirates, Kazakhstan, Kuwait, Iraq, Algeria, and Oman—had increased output quotas by 2.9 million barrels per day between April and December 2025, roughly 3.0% of global demand. However, in November the group froze further increases from January through March 2026 due to a noticeable slowdown in global consumption. Against this backdrop, a Reuters survey of leading economists shows that most respondents expect the average annual price of Brent crude to be around $60.00 per barrel.
Support and Resistance Levels
From a technical perspective, prices have corrected to 65.62 (Murray level [6/8]). A break below this level could extend the pullback toward 64.06 (Murray [5/8], middle Bollinger Band) and 62.50 (Murray [4/8]). For bulls, the key resistance remains at 67.18 (Murray [7/8]). A sustained move above this level would reopen the path toward 70.31 (Murray [+1/8]) and 71.87 (Murray [+2/8]).
Technical indicators continue to support the broader uptrend: Bollinger Bands are pointing higher, the MACD histogram is expanding in positive territory, and the Stochastic oscillator is exiting oversold conditions. While this does not rule out further short-term correction, its downside potential appears limited.
Resistance levels: 67.18, 70.31, 71.87.
Support levels: 65.62, 64.06, 62.50.
Trading Scenarios and Brent Crude Oil Outlook
Long positions may be considered above 67.18 or on a rebound from 64.06, with upside targets at 70.31 and 71.87. Stop-loss levels are placed at 65.60 and 62.55, respectively. Expected holding period: 5–7 days.
Scenario
| Timeframe | Weekly |
| Recommendation | BUY STOP |
| Entry point | 67.20 |
| Take Profit | 70.31, 71.87 |
| Stop Loss | 65.60 |
| Key levels | 62.50, 64.06, 65.62, 67.18, 70.31, 71.87 |
Alternative scenario
| Recommendation | BUY LIMIT |
| Entry point | 64.06 |
| Take Profit | 70.31, 71.87 |
| Stop Loss | 62.55 |
| Key levels | 62.50, 64.06, 65.62, 67.18, 70.31, 71.87 |
