Brent Crude Oil prices are trading within a long-term downward trend, forming a corresponding channel. Last week, quotes reached May lows near 58.55 but failed to break lower and corrected upward. The price is currently close to 59.37 (Murray level [–1/8]); a firm move below this level would confirm further downside toward 56.25 (Murray level [–2/8]) and 53.12 (Murray level [–2/8], D1). For bulls, the key resistance zone is seen at 64.00–65.62 (the middle Bollinger Band and Murray level [1/8]). A breakout above this area would allow prices to exit the channel through its upper boundary and rise toward 71.87 (Murray level [3/8]) and 75.00 (Murray level [4/8]). However, this scenario currently appears less likely in the near term.
Technical indicators continue to point to the persistence of the downtrend: the Bollinger Bands are directed lower, the MACD is increasing in negative territory, and the Stochastic oscillator is approaching oversold levels. This does not rule out a corrective rebound, although its potential appears limited.
Support and Resistance Levels
Resistance levels: 65.62, 71.87, 75.00.
Support levels: 59.37, 56.25, 53.12.
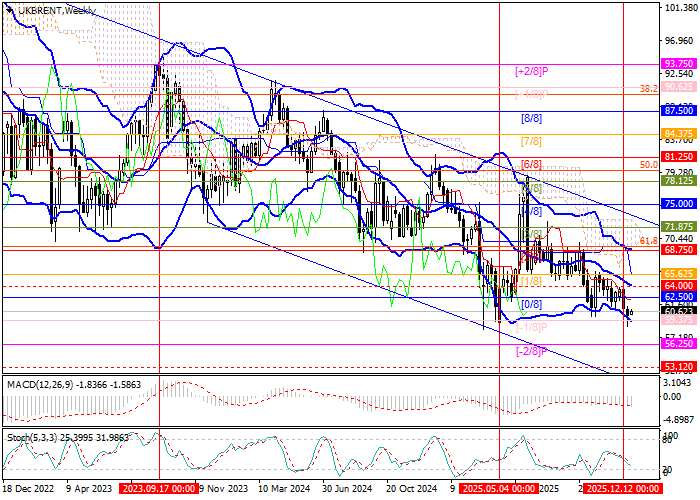
Trading Scenarios and Brent Crude Oil Forecast
Short positions should be considered below the 59.37 level with targets at 56.25 and 53.12, and a stop-loss at 61.70. Time horizon: 5–7 days.
Long positions can be opened above the 65.62 level with targets at 71.87 and 75.00, and a stop-loss at 62.80.
Scenario
| Timeframe |
Weekly |
| Recommendation |
SELL STOP |
| Entry point |
59.35 |
| Take Profit |
56.25, 53.12 |
| Stop Loss |
61.70 |
| Key levels |
53.12, 56.25, 59.37, 65.62, 71.87, 75.00 |
Alternative Scenario
| Recommendation |
BUY STOP |
| Entry point |
65.65 |
| Take Profit |
71.87, 75.00 |
| Stop Loss |
62.80 |
| Key levels |
53.12, 56.25, 59.37, 65.62, 71.87, 75.00 |
Forex Analyst & Educator
Sagar Dua has been associated with financial markets since his college days. He was pursuing a postgraduate degree in Commerce in 2018 when he started honing his skills at chart analysis and slowly mastered the art of fundamental principles as well as technical analysis.
Finance took him to academia and he ended up as an Assistant Professor at a public university sharing business students for one year. Eventually, Sagar passionately mentors newbie traders and investors by conducting several seminars and webinars on his expertise about the Forex market. Apart from financial acumen, motivational speaking runs in his veins to inspire people towards success in trading and finance