

Today at 21:00 (GMT+2), the results of the U.S. regulator’s meeting will be published. Investors are almost certain of a third consecutive rate cut of –25 basis points to 3.75%, supported by current economic conditions: the labor market shows signs of cooling (in November, employment dropped by 32,000 according to Automatic Data Processing (ADP)), domestic demand is weakening (September retail sales slowed to 0.2%), and inflation is easing (the core personal consumption expenditures price index declined from 2.9% to 2.8%). However, some officials remain concerned about price pressures, which still significantly exceed the 2.0% target. Traders expect a so-called “hawkish rate cut,” where borrowing costs are lowered but accompanied by direct indications of a pause in future monetary adjustments to assess the previously implemented measures. Nevertheless, such a scenario puts pressure on the dollar and supports precious metals.
On the other hand, the upward movement of safe-haven assets is limited by ongoing diplomatic negotiations aimed at resolving the Russia–Ukraine conflict. The U.S. special envoy Steve Witkoff has held several meetings with representatives from both sides in an attempt to ensure the implementation of Washington’s peace plans. A final compromise has not yet been reached. However, if successful, geopolitical tensions and sanctions pressure could significantly weaken, which would trigger a correction in gold prices.
Overall, traders maintain a wait-and-see approach amid heightened global uncertainty.
Support and Resistance Levels
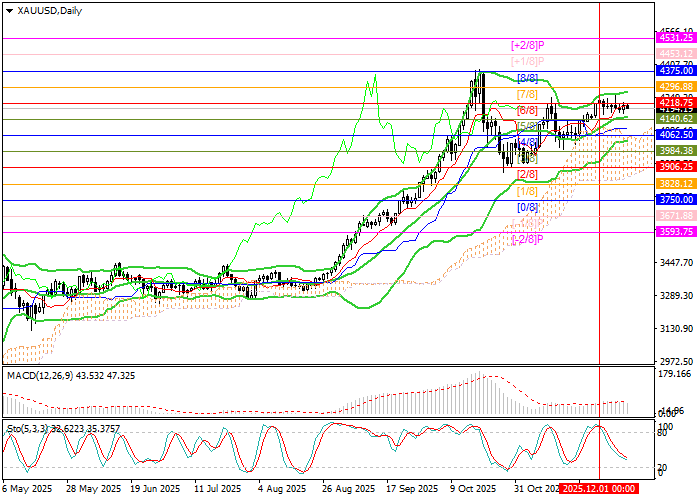
The trading instrument is located near 4218.75 (Murray level [6/8]). After breaking this level, annual highs at 4375.00 (Murray level [8/8]) and 4453.12 (Murray level [+1/8]) may be updated. However, if the lower Bollinger Band at 4062.50 (Murray level [4/8]) is breached, the price may reach 3906.25 (Murray level [2/8]) and 3750.00 (Murray level [0/8]).
Technical indicators maintain a buy signal: Bollinger Bands are aimed upward, the MACD histogram is stable in positive territory, and the Stochastic indicator is approaching the oversold area.
Resistance levels: 4218.75, 4375.00, 4453.12.
Support levels: 4062.50, 3906.25, 3750.00.
XAU/USD Trading Scenarios and Forecast
Long positions may be opened above 4218.75 with targets at 4375.00 and 4453.12, and a stop-loss at 4100.00. Estimated timeframe: 5–7 days.
Short positions may be opened below 4062.50 with targets at 3906.25 and 3750.00, and a stop-loss at 4180.00.
Scenario
| Timeframe | Weekly |
| Recommendation | BUY STOP |
| Entry Point | 4218.75 |
| Take Profit | 4375.00, 4453.12 |
| Stop Loss | 4100.00 |
| Key Levels | 3750.00, 3906.25, 4062.50, 4218.75, 4375.00, 4453.12 |
Alternative Scenario
| Recommendation | SELL STOP |
| Entry Point | 4062.50 |
| Take Profit | 3906.25, 3750.00 |
| Stop Loss | 4180.00 |
| Key Levels | 3750.00, 3906.25, 4062.50, 4218.75, 4375.00, 4453.12 |
