

Last weekend, US President Donald Trump announced that additional 10.0% import tariffs will be introduced from February 1 against a number of European countries, including Denmark, France, Germany, and the United Kingdom. The escalation was driven by these countries’ active support for Denmark amid territorial claims over Greenland by Washington. The Republican administration of the White House justifies the move on national security grounds, citing Greenland’s strategic position in the Arctic, as well as the island’s potential as a source of oil and other natural resources.
In turn, the EU is considering activating previously approved but suspended retaliatory tariffs on US goods totaling around €93.0 billion. These measures would affect a broad range of products, including aircraft, automobiles, alcohol, and other high-value industrial goods, making them potentially painful for the US economy. Trump’s remarks about additional tariffs, with a possible increase to 25.0% in June, were perceived by European leaders as an attempt to pressure allies, triggering sharp criticism from Germany, France, the United Kingdom, and Nordic countries. At the same time, the EU is discussing the possible use of the Anti-Coercion Instrument (ACI), which allows measures beyond standard tariffs, including restrictions on market access, investments, and public procurement if actions by a third party are deemed coercive.
At the same time, Brussels is discussing a freeze on the ratification of the EU–US trade agreement signed in 2025, which would serve as a political signal against unilateral actions by the White House. For financial markets, this situation creates elevated risks: Bloomberg Economics estimates that if 25.0% tariffs are imposed, exports from the most vulnerable EU countries to the US could fall by up to 50.0% in certain sectors. This would negatively affect corporate earnings, investment flows, and transatlantic trade, requiring companies and investors to actively manage risks and closely monitor further diplomatic steps by both the EU and the US.
Macroeconomic data from the eurozone released yesterday had little impact on the pair’s dynamics. As expected, the core consumer price index rose by 2.3% year-on-year in December and by 0.3% month-on-month, while the broader CPI eased slightly from 2.0% to 1.9% YoY and increased by 0.2% MoM. This confirms that inflation is not currently a major issue for the region. The European Central Bank (ECB) is likely to maintain a wait-and-see stance for an extended period, which could become a notable competitive advantage for the euro versus the US dollar, as the Federal Reserve is projecting at least one 25-basis-point rate cut this year.
Today at 09:00 (GMT+2), investors will focus on German producer inflation data for December, while at 12:00 (GMT+2) January business sentiment data from the ZEW Center for European Economic Research will be released. Forecasts suggest that the eurozone economic sentiment index will rise from 33.7 to 35.2 points, while Germany’s index is expected to increase from 45.8 to 50.0 points. In the US, the ADP employment report will be released at 15:15 (GMT+2).
Support and resistance levels
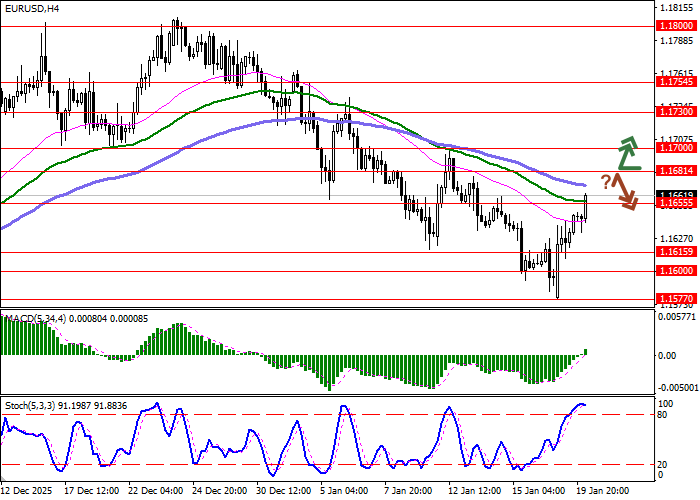
Bollinger Bands on the daily chart show a confident downward move, with the price range narrowing from below, reflecting a sharp shift in short-term market direction. MACD is turning higher, forming a new buy signal as the histogram attempts to move above the signal line. The Stochastic oscillator shows similar dynamics, rebounding from the 20 level, which indicates moderate oversold risks for the euro in the very short term.
Resistance levels: 1.1681, 1.1700, 1.1730, 1.1754.
Support levels: 1.1655, 1.1615, 1.1600, 1.1577.
Trading scenarios and EUR/USD outlook
Long positions may be opened after a confident upside breakout above 1.1681, targeting 1.1730. Stop-loss: 1.1655. Time horizon: 2–3 days.
A rebound from 1.1681 as resistance followed by a downside break below 1.1655 may signal new short positions with a target at 1.1600. Stop-loss: 1.1681.
Scenario
| Timeframe | Intraday |
| Recommendation | BUY STOP |
| Entry point | 1.1685 |
| Take Profit | 1.1730 |
| Stop Loss | 1.1655 |
| Key levels | 1.1577, 1.1600, 1.1615, 1.1655, 1.1681, 1.1700, 1.1730, 1.1754 |
Alternative scenario
| Recommendation | SELL STOP |
| Entry point | 1.1650 |
| Take Profit | 1.1600 |
| Stop Loss | 1.1681 |
| Key levels | 1.1577, 1.1600, 1.1615, 1.1655, 1.1681, 1.1700, 1.1730, 1.1754 |
