

According to the report, the average asking price for residential properties listed for sale in January may rise by 2.8% to £368.031K on a monthly basis, marking a record high for the series. The national average is now 0.5% higher than a year earlier, following the adoption of a budget that included changes to the sector’s tax policy. In the two weeks after the Christmas holidays, buyer demand was 57.0% higher than in the comparable pre-holiday period, while the number of newly listed properties jumped by 81.0%. Incoming data indicate stronger activity at the start of the year, also supported by easier credit conditions: according to the agency’s daily mortgage tracker, the average rate on a two-year fixed mortgage has fallen to its lowest level since September 2022, as many major lenders cut rates to stimulate demand.
An additional supportive factor could be a shift toward looser monetary policy in the second half of the year if inflationary pressures ease. Market participants note that the rise in supply from sellers may restrain further price acceleration, creating more balanced conditions for transactions. This week, investors and market participants will focus on labor-market and inflation data, which form key benchmarks for the Bank of England ahead of its next interest-rate decision.
Meanwhile, the dollar is attempting to extend its decline after a brief correction, with USDX trading around 98.70. No highly volatile macroeconomic releases are expected, and the fundamental backdrop remains negative after US President Donald Trump announced higher import tariffs for eight European countries—by 10.0% from February 1 and by 25.0% from June 1. EU countries are the largest holders of US government debt, owning equities and bonds worth $8.0 trillion—almost twice as much as the rest of the world combined. If they decide to sell off these assets, the dollar could lose significant value.
Support and resistance levels
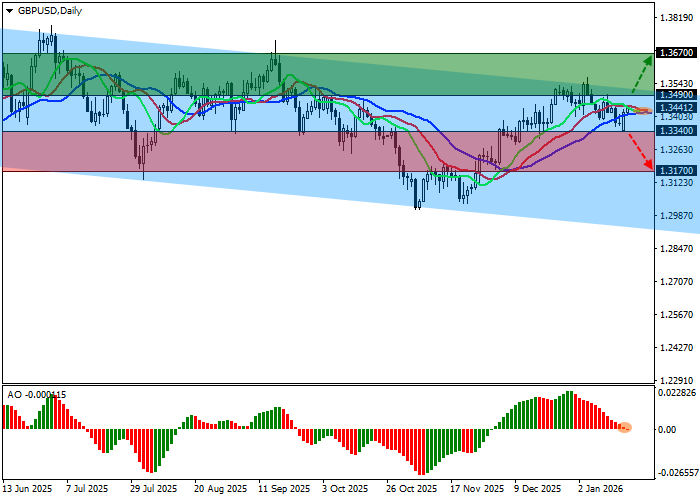
On the daily chart, the instrument is correcting, holding slightly below the resistance line of a descending channel with dynamic boundaries at 1.3540–1.2900.
Technical indicators maintain an unstable buy signal: the fast EMAs of the Alligator indicator are slightly above the signal line and moving toward it, while the AO histogram is forming descending bars, slipping within positive territory.
Resistance levels: 1.3490, 1.3670.
Support levels: 1.3340, 1.3170.
Trading scenarios and GBP/USD outlook
Long positions may be opened after growth and a firm break above 1.3490, targeting 1.3670. Stop-loss: 1.3430. Time horizon: 7 days or longer.
Short positions may be opened after a decline and a firm break below 1.3340, targeting 1.3170. Stop-loss: 1.3500.
Scenario
| Timeframe | Weekly |
| Recommendation | BUY STOP |
| Entry point | 1.3490 |
| Take Profit | 1.3670 |
| Stop Loss | 1.3430 |
| Key levels | 1.3170, 1.3340, 1.3490, 1.3670 |
Alternative scenario
| Recommendation | SELL STOP |
| Entry point | 1.3340 |
| Take Profit | 1.3170 |
| Stop Loss | 1.3500 |
| Key levels | 1.3170, 1.3340, 1.3490, 1.3670 |
