

Market optimism returned following a series of statements by U.S. President Donald Trump made during the World Economic Forum (WEF) in Davos. In particular, the politician said that he had reached an agreement with NATO Secretary General Mark Rutte on the framework of a deal regarding Greenland. The White House did not disclose specific terms, but experts believe the agreement could involve transferring part of the island into indefinite U.S. control, including rights to build military facilities and develop mineral resources.
Trump also backed away from the previously announced introduction of 10.0% tariffs on exports from several European countries, prompting investors to move away from safe-haven assets in favor of the U.S. dollar. However, despite his comments, EU representatives did not cancel today’s emergency summit aimed at developing retaliatory economic measures should a final compromise on Greenland fail to materialize. Two scenarios are reportedly under consideration: a softer option involving counter-sanctions worth €93.0 billion ($108.0 billion), and a tougher approach utilizing the Anti-Coercion Instrument (ACI), which would restrict U.S. companies’ access to European financial markets.
At 15:30 (GMT+2) today, U.S. gross domestic product (GDP) data for the third quarter will be released. According to forecasts, the figure is expected to rise from 3.8% to 4.3%, which could further strengthen the dollar and increase the likelihood that the Federal Reserve will maintain current interest rates in the medium term.
Support and Resistance Levels
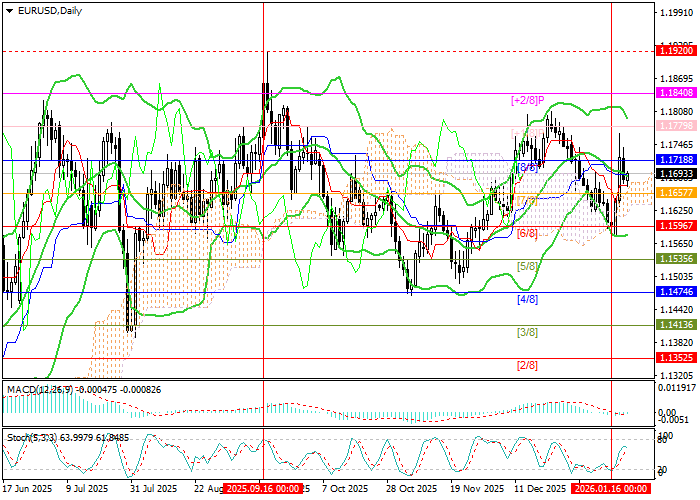
The trading instrument remains near the middle line of the Bollinger Bands. A sustained move above 1.1779 (Murray level [7/8]), which was actively tested last month, could trigger further upside momentum toward the September high of 1.1920. Conversely, a break below 1.1596 (Murray level [6/8]) would likely resume the downward trend toward targets at 1.1474 (Murray level [4/8]) and 1.1352 (Murray level [2/8]).
Technical indicators provide mixed signals: the Bollinger Bands are turning downward, the MACD histogram is hovering near the zero line with limited volume, while the Stochastic oscillator is pointing upward.
Resistance levels: 1.1779, 1.1920.
Support levels: 1.1596, 1.1474, 1.1352.
Trading Scenarios and EUR/USD Forecast
Short positions can be opened below 1.1596, targeting 1.1474 and 1.1352, with a stop-loss at 1.1680. Time horizon: 5–7 days.
Long positions can be opened above 1.1779, targeting 1.1920, with a stop-loss at 1.1710.
Scenario
| Timeframe | Weekly |
| Recommendation | SELL STOP |
| Entry point | 1.1595 |
| Take Profit | 1.1474, 1.1352 |
| Stop Loss | 1.1680 |
| Key levels | 1.1352, 1.1474, 1.1596, 1.1779, 1.1920 |
Alternative Scenario
| Recommendation | BUY STOP |
| Entry point | 1.1780 |
| Take Profit | 1.1920 |
| Stop Loss | 1.1710 |
| Key levels | 1.1352, 1.1474, 1.1596, 1.1779, 1.1920 |
