

Ahead of the Christmas holidays, the sector is receiving some support from rising geopolitical tensions in Venezuelan territorial waters, where the U.S. Coast Guard continues to pursue tankers carrying crude oil both into and out of the country, according to Reuters. In particular, the crew of the Panama-flagged vessel Bella 1 reportedly denied U.S. military personnel access on board, while American forces are now awaiting authorization to seize the ship. It also became known that the White House intends to retain hydrocarbons found on seized vessels, a move that sparked sharp criticism from several leading countries during a specially convened United Nations meeting to address the situation.
Another supportive factor for the industry is a Bloomberg report showing that Russia’s seaborne crude exports have reached a two-year high, with average daily volumes climbing to 3.87 million barrels by the end of December. Despite efforts to curb supplies through sanctions, a significant accumulation of oil-laden vessels has been observed near ports in China and India, with total volumes rising by 48.0% since early autumn to 185.0 million barrels. Meanwhile, the publication schedule for fuel inventory data has shifted this week due to the Christmas holiday. According to the American Petroleum Institute (API), commercial energy stockpiles increased from –9.300 million barrels to 2.400 million barrels over the past week. The report from the U.S. Energy Information Administration (EIA) is expected to be released only on Monday after the holidays, with analysts forecasting another decline of around –1.274 million barrels. Investment demand continues to weaken, and during the most recent trading session on the Chicago Mercantile Exchange (CME Group), open futures positions totaled 588.0 thousand contracts, below the December average of 690.0 thousand.
Support and Resistance Levels
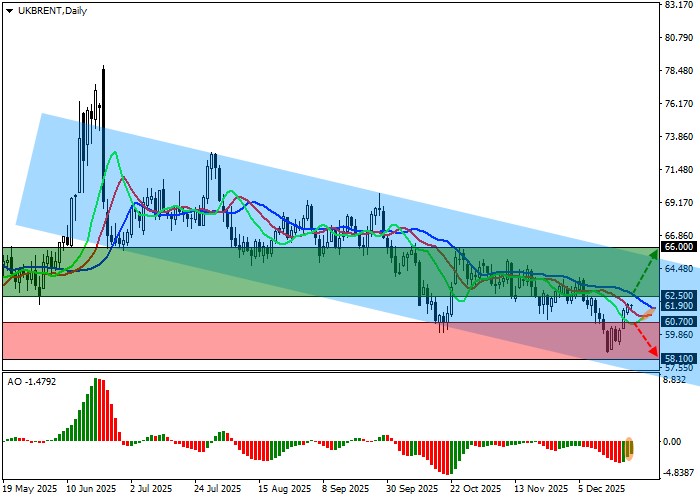
On the daily chart, the instrument is moving toward the resistance line of a descending channel with dynamic boundaries at 66.00–57.00, as part of a corrective upward wave.
Technical indicators are weakening the sell signal: the fast EMAs of the Alligator indicator remain below the signal line but are converging toward it, while the Awesome Oscillator histogram is forming corrective bars in negative territory.
Resistance levels: 62.50, 66.00.
Support levels: 60.70, 58.10.
Trading Scenarios and Brent Crude Oil Price Forecast
Long positions can be opened after price rises and consolidates above the 62.50 level, with a target at 66.00. Stop-loss — 61.00. Time horizon: 7 days or longer.
Short positions can be opened after price declines and consolidates below the 60.70 level, with a target at 58.10. Stop-loss — 62.00.
Scenario
| Timeframe | Weekly |
| Recommendation | BUY STOP |
| Entry point | 62.55 |
| Take Profit | 66.00 |
| Stop Loss | 61.00 |
| Key levels | 58.10, 60.70, 62.50, 66.00 |
Alternative Scenario
| Recommendation | SELL STOP |
| Entry point | 60.65 |
| Take Profit | 58.10 |
| Stop Loss | 62.00 |
| Key levels | 58.10, 60.70, 62.50, 66.00 |
