

Support for the commodity is also coming from concerns over potential supply disruptions from Venezuela after US President Donald Trump announced a full maritime blockade of the country last week, citing efforts to combat drug trafficking. US forces have already intercepted two tankers. In addition, the risk of targeted ground operations or air strikes remains on the table, which could further reduce hydrocarbon shipments. Venezuela’s share of global oil output is roughly 1.0%, and OPEC or the United States could offset the lost volume. Tensions also persist around Russian energy exports: amid a wide range of restrictions, Moscow has been forced to increase discounts to keep seaborne trade moving, pressuring prices in a highly uneven market marked by oversupply. Meanwhile, the likelihood of a resolution to the Russia–Ukraine conflict—which is closely linked to the possibility of sanctions relief—remains low, although some progress was recorded in December.
Later today at 15:30 (GMT+2), the market will receive US third-quarter GDP data, with growth expected to slow from 3.8% to 3.2%. This could reinforce expectations of further Fed easing. In December, the Fed cut the policy rate by 25 basis points to 3.75% and kept its guidance for next year intact: only one additional move of the same size is projected for all of 2026. At the same time, the Fed revised its growth outlook higher on improved global prospects and expects lower inflation over the next few years. At 15:15 (GMT+2), ADP employment figures for the last four weeks will be released; the previous reading showed an increase of 16.25K jobs. The US labor market remains a key reference point for policymakers when setting the direction of monetary policy.
For now, a downward trend is taking shape in the sector. According to the Chicago Mercantile Exchange (CME Group), the world’s largest financial derivatives marketplace, as of December 19 the number of crude oil futures positions stood at 509.0K, while options positions totaled 98.7K—well below early-December averages of 623.0K and 100.0K, respectively. This decline reflects year-end expiries and the liquidation of a significant share of large positions.
Support and resistance levels
On the daily chart, Bollinger Bands are edging lower: the price range is narrowing from the top while still leaving ample room given the current level of market activity. MACD is rising while maintaining a firm buy signal (the histogram remains below the signal line), and the Stochastic is hovering near its highs, pointing to the risk of overbought conditions in the near term.
Resistance levels: 58.08, 58.51, 58.95, 59.42.
Support levels: 57.56, 57.00, 56.21, 55.54.
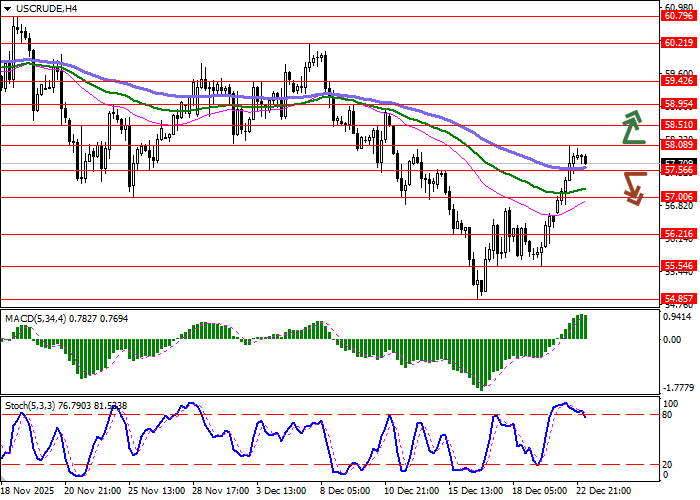
Trading scenarios and WTI Crude Oil outlook
Long positions can be considered after a confident breakout above 58.08, targeting 58.95. Stop loss: 57.56. Time horizon: 2–3 days.
Short positions can be considered after a breakdown below 57.56, targeting 56.21. Stop loss: 58.08.
Scenario
| Timeframe | Intraday |
| Recommendation | BUY STOP |
| Entry | 58.10 |
| Take Profit | 58.95 |
| Stop Loss | 57.56 |
| Key Levels | 55.54, 56.21, 57.00, 57.56, 58.08, 58.51, 58.95, 59.42 |
Alternative scenario
| Recommendation | SELL STOP |
| Entry | 57.55 |
| Take Profit | 56.21 |
| Stop Loss | 58.08 |
| Key Levels | 55.54, 56.21, 57.00, 57.56, 58.08, 58.51, 58.95, 59.42 |
