

The current sideways price movement was driven by a decline in demand across all precious metals as markets transitioned to new 2026 contracts. Nevertheless, this now appears to be a local correction, after which the upward trend may resume. The World Platinum Investment Council (WPIC) expects total platinum supply in 2025 to reach 7,129 thousand ounces, reflecting a 2.0% increase year-on-year. Mine supply, according to preliminary data, is set to decline by 5.0% annually, as producers have not yet returned to 2024 output levels, while total demand is expected to rise by 5.0% to 7,821 thousand ounces. Industrial demand was down 22.0% year-on-year, and the market is projected to post a deficit of 0.692 thousand ounces by year-end.
As for investment demand, official data point to a decline of 0.385 thousand ounces due to a short-term reduction of 0.437 thousand ounces at the start of 2026. The projected investment outflow on the Chicago Mercantile Exchange (CME Group Inc.) may reach up to 0.150 thousand ounces in short positions and up to 0.170 thousand ounces in ETF holdings.
Meanwhile, the Commodity Futures Trading Commission (CFTC) reports a net reduction in long positions in the real-money category by 7,074 contracts, bringing the total to 18,626 contracts, while short positions fell by 14,546 contracts. This represents a significant convergence compared with the gap of more than 40,000 contracts recorded in early December last year.
According to data from the Chicago Mercantile Exchange (CME Group Inc.), only 42,049 platinum futures positions were recorded yesterday, along with 1,619 options contracts. By contrast, in the final days of December last year, futures positions totaled around 110,000 contracts, while options reached approximately 5,500 contracts.
Support and Resistance Levels
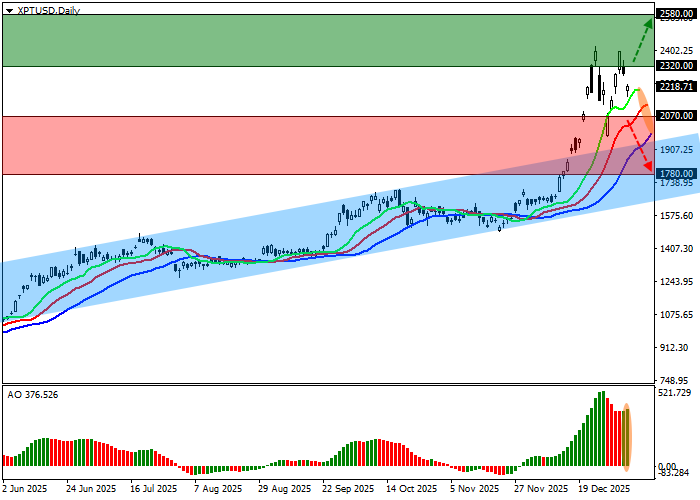
On the daily chart, the price remains above the resistance line of the ascending channel with boundaries at 2000.00–1720.00, attempting to build on the recent recovery attempt.
Technical indicators have turned and are maintaining a renewed buy signal, which is strengthening again amid the local rebound: the AO histogram remains in positive territory above the zero line, indicating a short-term bullish trend, while the fast EMAs of the Alligator indicator continue to hold above the signal line.
Support levels: 2070.00, 1780.00.
Resistance levels: 2320.00, 2580.00.
Trading Scenarios and XPT/USD Price Outlook
If the upward move continues and the price consolidates above the resistance level at 2320.00, long positions will be relevant with a target at 2580.00. Stop-loss: 2250.00. Time horizon: 7 days or longer.
If the decline resumes and the price consolidates below the support level at 2070.00, short positions become relevant with a target at 1780.00. Stop-loss: 2200.00.
Scenario
| Timeframe | Weekly |
| Recommendation | BUY STOP |
| Entry point | 2320.05 |
| Take Profit | 2580.00 |
| Stop Loss | 2250.00 |
| Key levels | 1780.00, 2070.00, 2320.00, 2580.00 |
Alternative Scenario
| Recommendation | SELL STOP |
| Entry point | 2069.95 |
| Take Profit | 1780.00 |
| Stop Loss | 2200.00 |
| Key levels | 1780.00, 2070.00, 2320.00, 2580.00 |
