
Today at 09:00 (GMT+2), investors and forex traders will focus on Germany’s import price index for November. Forecasts suggest a slowdown in monthly growth from 0.2% to 0.1%, further easing already subdued inflation risks in Germany and the broader euro area. Meanwhile, Spain will release third-quarter GDP data at 10:00 (GMT+2). The economy is expected to slow from 0.8% to 0.6% quarter-on-quarter and from 3.1% to 2.8% year-on-year. Market participants are also assessing recent ECB rhetoric: Governing Council member Gediminas Šimkus stated that the outlook for borrowing costs looks fairly clear given controlled inflation and ongoing economic growth. In his view, both headline and core inflation are likely to remain close to the 2.0% target in the short and medium term, while the current interest rate can be considered neutral.
In the United States, GDP data will be released today at 15:30 (GMT+2). Annual growth is expected to slow from 3.8% to 3.2%, potentially reinforcing expectations that the Federal Reserve could consider easing monetary policy in 2026. Official Fed projections currently point to just one 25-basis-point rate cut, while markets are pricing in at least two. However, policymakers may prefer to pause until clearer signs emerge of inflation sustainably returning to the 2.0% target or a more pronounced cooling in the labor market. US annual CPI slowed to 2.7% in November from 3.0%, although the data may have been distorted by the prolonged federal government shutdown. In addition, October and November industrial production figures will be published today at 15:30 (GMT+2); output rose by a modest 0.1% in September.
Support and resistance levels
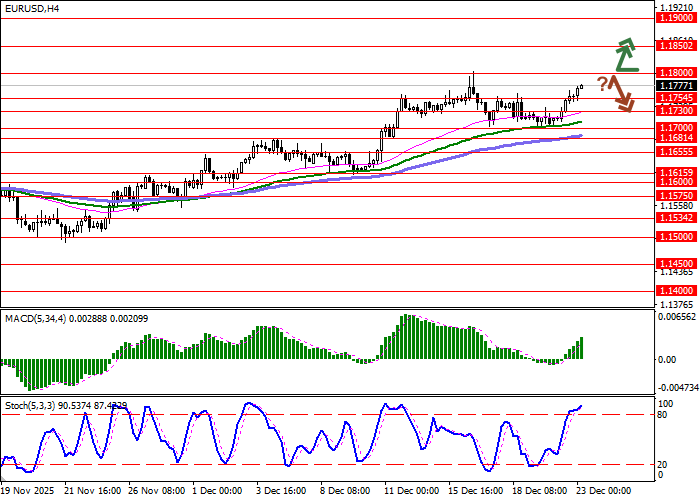
Bollinger Bands on the daily chart are showing steady upward expansion, opening the way for bulls to target new local highs. The MACD is rising and has generated a fresh buy signal, with the histogram moving above the signal line. The Stochastic oscillator has turned higher near the 20 level and maintains a confident upward bias, signaling further bullish momentum in the near term.
Resistance levels: 1.1800, 1.1850, 1.1900, 1.1950.
Support levels: 1.1754, 1.1730, 1.1700, 1.1681.
Trading scenarios and EUR/USD forecast
Long positions can be considered after a confident breakout above 1.1800, with a target at 1.1900. Stop-loss: 1.1754. Time horizon: 2–3 days.
A rebound from the 1.1800 resistance followed by a downside break below 1.1754 could signal the opening of short positions, targeting 1.1655. Stop-loss: 1.1800.
Scenario
| Timeframe | Intraday |
| Recommendation | BUY STOP |
| Entry point | 1.1805 |
| Take Profit | 1.1900 |
| Stop Loss | 1.1754 |
| Key levels | 1.1681, 1.1700, 1.1730, 1.1754, 1.1800, 1.1850, 1.1900, 1.1950 |
Alternative scenario
| Recommendation | SELL STOP |
| Entry point | 1.1750 |
| Take Profit | 1.1655 |
| Stop Loss | 1.1800 |
| Key levels | 1.1681, 1.1700, 1.1730, 1.1754, 1.1800, 1.1850, 1.1900, 1.1950 |
