

In the United States, inflation data due at 15:30 (GMT+2) today may influence future Federal Reserve interest rate decisions. Analysts expect core consumer price inflation (excluding food and energy) to hold at 3.0%, while the broader CPI is forecast to edge up from 3.0% to 3.1%. If confirmed, these figures could reinforce the case for the Fed to pause its rate-cutting cycle. At the same time, weekly jobless claims data will be released: initial claims for the week ending December 12 are expected to decline from 236.0K to 225.0K, while continuing claims are projected to rise from 1.838 million to 1.940 million.
Meanwhile, Japanese investors and forex traders are preparing for the release of November inflation data on Friday at 01:30 (GMT+2). Core CPI excluding fresh food is expected to come in at 3.0%. In addition, the Bank of Japan will announce its policy decision at 05:00 (GMT+2). According to a Bloomberg survey, all 50 economists expect the central bank to raise its benchmark interest rate to 0.75%. As this move is largely priced in, analysts say the focus will be on forward guidance regarding the pace of further tightening and the potential peak of the hawkish cycle. Nearly two-thirds of respondents believe the BoJ will adjust rates roughly every six months starting in December, around 20% expect changes only once a year, and just 2% anticipate quarterly moves. The median forecast for the terminal rate in this cycle has risen to 1.25%, implying two additional hikes after the current one, although some experts believe the central bank may then pause tightening amid stabilizing inflation risks and the economic policy stance of Japan’s new prime minister, Sanae Takaichi.
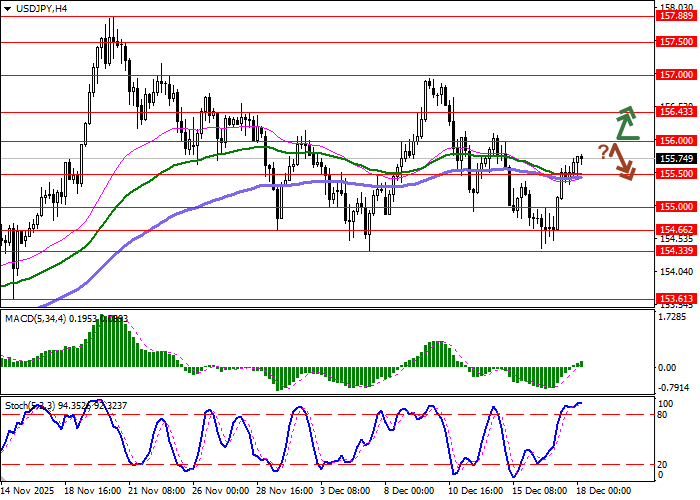
Support and resistance levels
On the daily chart, Bollinger Bands are flattening, indicating a shift to sideways movement: the price range is largely unchanged but remains wide enough for current market activity. MACD is turning higher, generating a fresh buy signal as the histogram attempts to move above the signal line. The Stochastic oscillator is also showing a more pronounced upward move, pulling away from the 20 level, which suggests easing short-term oversold risks for the US dollar.
Resistance levels: 156.00, 156.43, 157.00, 157.50.
Support levels: 155.50, 155.00, 154.66, 154.33.
Trading scenarios and USD/JPY forecast
Long positions may be opened after a clear breakout above 156.00, with a target at 157.00. Stop-loss: 155.50. Time horizon: 1–3 days.
A rebound from 156.00 as resistance followed by a break below 155.50 could signal the opening of new short positions targeting 154.66. Stop-loss: 156.00.
Scenario
| Timeframe | Intraday |
| Recommendation | BUY STOP |
| Entry point | 156.00 |
| Take Profit | 157.00 |
| Stop Loss | 155.50 |
| Key levels | 154.33, 154.66, 155.00, 155.50, 156.00, 156.43, 157.00, 157.50 |
Alternative scenario
| Recommendation | SELL STOP |
| Entry point | 155.50 |
| Take Profit | 154.66 |
| Stop Loss | 156.00 |
| Key levels | 154.33, 154.66, 155.00, 155.50, 156.00, 156.43, 157.00, 157.50 |
