

Toward the end of last week, market participants assessed the financial results of French luxury fashion house Hermès International S.C.A., which reported revenue of €4.09 billion, exceeding analysts’ expectations of €4.07 billion and €3.96 billion recorded in the same period a year earlier. Meanwhile, Safran SA—one of the global leaders in aerospace, defense, and security—posted revenue of €8.71 billion compared with €7.85 billion previously and €14.42 billion in the prior period. Earnings per share (EPS) came in at €3.88, slightly below the forecast of €3.92 but significantly better than the loss of €1.78 recorded earlier. In turn, management of Capgemini SE, a leading company in management consulting, IT services, digital transformation, and outsourcing, reported revenue of €5.97 billion, above investors’ preliminary estimates of €5.66 billion and €5.58 billion previously, while EPS stood at €7.75 compared with €4.60 last year.
As for the bond market, following an interim peak at 2.150%, yields have entered a consolidation phase. One-year bonds are currently trading at 2.106%, down from 2.145% on Friday. Ten-year yields stand at 3.345%, noticeably below last week’s 3.392%, while 20-year and 30-year yields are holding near 4.010% and 4.317%, respectively, compared with 4.054% and 4.342% previously.
At present, the main gainers within the index are Safran SA (+8.30%), Capgemini SE (+5.12%), Eurofins Scientific SE (+2.25%), Renault SA (+1.89%), and Compagnie Générale des Établissements Michelin SCA (+1.65%).
Among the decliners are Société Générale SA (–5.42%), L’Oréal SA (–4.93%), BNP Paribas SA (–2.39%), LVMH Moët Hennessy – Louis Vuitton SE (–1.96%), and Sanofi SA (–1.87%).
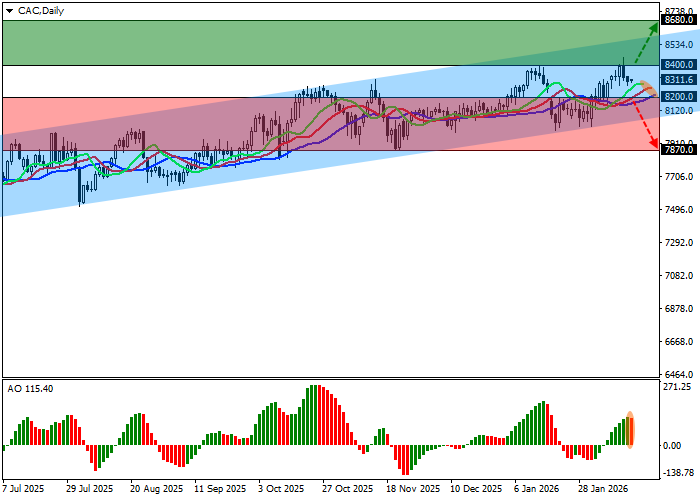
Support and resistance levels
On the daily chart, index prices are attempting to move away from the resistance line of the ascending channel, with dynamic boundaries at 8550.0–8100.0.
Technical indicators are maintaining a buy signal received recently: the fast EMAs on the Alligator indicator are widening their range, while the Awesome Oscillator (AO) histogram is forming corrective bars slightly below the zero line.
Support levels: 8200.0, 7870.0.
Resistance levels: 8400.0, 8680.0.
Trading scenarios and CAC 40 outlook
Long positions may be considered after a firm breakout and consolidation above 8400.0, with a target at 8680.0 and a stop loss at 8300.0. Time horizon: 7 days or more.
Short positions may be considered after consolidation below 8200.0, with a target at 7870.0. Stop loss: 8300.0.
Scenario
| Timeframe | Weekly |
| Recommendation | BUY STOP |
| Entry point | 8400.5 |
| Take Profit | 8680.0 |
| Stop Loss | 8300.0 |
| Key levels | 7870.0, 8200.0, 8400.0, 8680.0 |
Alternative scenario
| Recommendation | SELL STOP |
| Entry point | 8199.5 |
| Take Profit | 7870.0 |
| Stop Loss | 8300.0 |
| Key levels | 7870.0, 8200.0, 8400.0, 8680.0 |
