

Corporate earnings season continues. Walmart Inc. reported revenue of $177.4 billion versus $169.3 billion last year, but EPS of $0.68 fell short of the $0.74 forecast. Ross Stores Inc. posted revenue of $5.53 billion (below $5.54 billion expected) and EPS declined to $1.56 from $1.59 year-over-year.
Bond markets add pressure as yields rise again: the 10-year Treasury yield climbed to 4.331% from 4.301% last week, while the 20-year moved to 4.900% from 4.873%.
Top gainers in the Dow Jones include Merck & Co. (+1.68%), Chevron (+1.52%), and UnitedHealth (+1.17%). Decliners are led by Walmart (–4.49%), IBM (–1.30%), and Home Depot (–1.01%).
Support and Resistance Levels
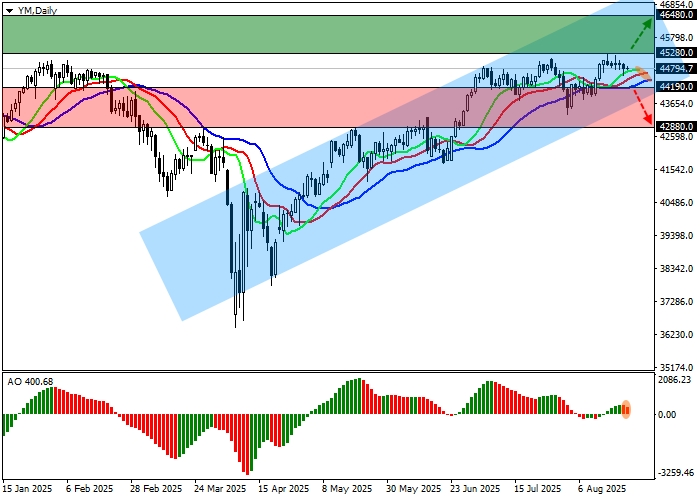
On the daily chart, the index remains in a corrective phase after failing to break the quarterly high of 45,220.0. Technical indicators maintain a fragile bullish outlook: EMA ranges on the Alligator remain narrow, and AO histogram shows corrective bars just below the zero line.
Support: 44,190.0, 42,880.0
Resistance: 45,280.0, 46,480.0
Trading Scenarios
Long positions may be considered above 45,280.0 with a target at 46,480.0 and stop-loss at 44,800.0. Implementation timeframe: 7 days or more.
Short positions may be considered below 44,190.0 with a target at 42,880.0 and stop-loss at 44,800.0.
Scenario
- Timeframe: Weekly
- Recommendation: BUY STOP
- Entry Point: 45,280.0
- Take Profit: 46,480.0
- Stop Loss: 44,800.0
- Key Levels: 42,880.0, 44,190.0, 45,280.0, 46,480.0
Alternative Scenario
- Recommendation: SELL STOP
- Entry Point: 44,190.0
- Take Profit: 42,880.0
- Stop Loss: 44,800.0
- Key Levels: 42,880.0, 44,190.0, 45,280.0, 46,480.0
