

Pressure on quotes is coming from the partial shutdown of government agencies, as Democrats and Republicans failed to reach consensus on the new fiscal year budget. Moreover, Congress is currently not conducting open negotiations to secure even a temporary extension until November. As a result, some macroeconomic reports, such as the September nonfarm payrolls data, may be released later than scheduled. However, this delay is unlikely to have a significant effect on the rhetoric of the U.S. Federal Reserve, which is already maintaining a cautious stance.
Previously, President Donald Trump warned that the pause in federal operations could be used for large-scale budget cuts as part of his cost-optimization policy. For example, the U.S. Agency for International Development (USAID) was nearly dismantled earlier after harsh criticism from the Republican wing of Congress. Last night, the White House Office of Management and Budget issued a memorandum confirming the shutdown and placing responsibility on the Democratic Party, whose representatives are pushing for extended tax benefits to make healthcare more affordable. In addition, global market sentiment is further weighed down by Trump’s new tariffs: on October 14, a 10.0% duty will be imposed on imported lumber and a 25.0% duty on certain kitchen furniture and fittings.
Yesterday, the JOLTS job openings report for the nonfarm sector was published: in August the figure rose from 7.208 million to 7.227 million, slightly exceeding market expectations of 7.200 million. At 14:15 (GMT+2), investors will turn their attention to the September employment report from Automatic Data Processing (ADP), with preliminary estimates suggesting a decline from 54,000 to 50,000.
Support and Resistance Levels
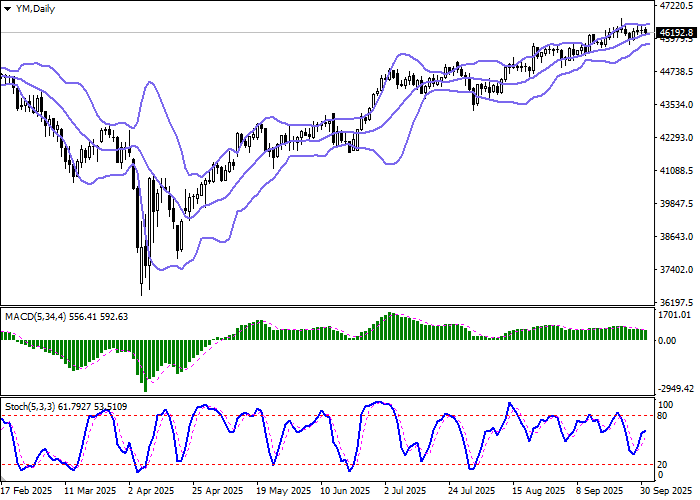
On the daily chart, Bollinger Bands are showing hesitant growth: the price range indicates flat dynamics but remains wide enough for the current activity. The MACD indicator is moving further below the signal line, maintaining a weak sell signal, while the Stochastic is pointing upward, reflecting the potential for gains in the near term.
Resistance levels: 46350.0, 46550.0, 46712.5, 46870.0.
Support levels: 46150.0, 45900.0, 45600.0, 45300.0.
Trading Scenarios and DJIA Forecast
Short positions can be opened after a confident breakdown of 46150.0 downward with a target at 45600.0. Stop-loss — 46400.0. Timeframe: 2–3 days.
Long positions can be opened after a rebound from 46150.0 and a breakout above 46350.0 with a target at 46712.5. Stop-loss — 46150.0.
Scenario
| Timeframe | Intraday |
| Recommendation | SELL STOP |
| Entry Point | 46150.0 |
| Take Profit | 45600.0 |
| Stop Loss | 46400.0 |
| Key Levels | 45300.0, 45600.0, 45900.0, 46150.0, 46350.0, 46550.0, 46712.5, 46870.0 |
Alternative Scenario
| Recommendation | BUY STOP |
| Entry Point | 46350.0 |
| Take Profit | 46712.5 |
| Stop Loss | 46150.0 |
| Key Levels | 45300.0, 45600.0, 45900.0, 46150.0, 46350.0, 46550.0, 46712.5, 46870.0 |
