

Analysts expect a sharp slowdown in the pace of non-farm payroll job creation from 119.0 thousand, as last month saw mass layoffs caused by the aftermath of a record 43-day government shutdown. Wage growth in October and November, according to preliminary estimates, is expected to remain unchanged at 0.2% month-on-month and 3.8% year-on-year, respectively, while the unemployment rate is also projected to stay at 4.4%. It should be recalled that strong labor market data would significantly reduce expectations for a Federal Reserve interest rate cut in January. Meanwhile, market participants are still reacting to the outcome of last week’s two-day Federal Reserve monetary policy meeting: as most analysts had anticipated, the key interest rate was cut by 25 basis points to 3.75%. At the same time, projections for borrowing costs in 2026 and 2027 were left unchanged, although the regulator improved its outlook for inflation dynamics and US economic growth in the near term.
At the same time, US equity markets are facing pressure from growing concerns about declining returns on investments in artificial intelligence (AI)-related technologies. In particular, traders reacted negatively on Friday to a weak quarterly report from technology giant Oracle Corp., which showed a significant increase in capital expenditures. It also became known that AI research company OpenAI has postponed the completion of several data centers from 2027 to 2028, which further undermined investor confidence in the sector’s prospects. While the industry continues to see a significant increase in the number of companies developing generative AI-based solutions, many of them are still not generating actual profits. Moreover, a recent wave of layoffs across the sector, combined with attempts to replace parts of the workforce with artificial intelligence, has further complicated the labor market situation, which is already showing signs of cooling.
Support and resistance levels
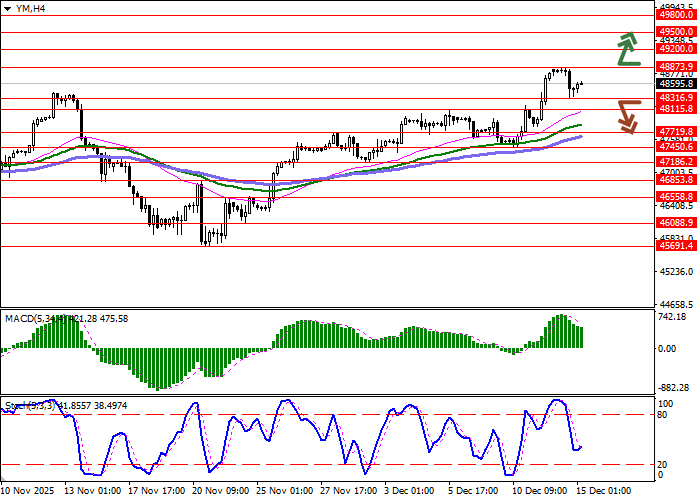
On the daily chart, Bollinger Bands are showing moderate upward movement: the price range is expanding to the upside, opening the way for bulls toward record highs. The MACD indicator is rising and maintains a strong buy signal, with the histogram positioned above the signal line. At the same time, the Stochastic oscillator, having approached its maximum values, is attempting to turn downward, indicating moderate overbought risks for the index in the very short term.
Resistance levels: 48,873.9, 49,200.0, 49,500.0, 49,800.0.
Support levels: 48,316.9, 48,115.8, 47,719.8, 47,450.6.
Trading scenarios and DJIA index outlook
Short positions may be opened after a confident downside breakout below the 48,316.9 level, with a target at 47,450.6 and a stop-loss at 48,800.0. Time horizon: 2–3 days.
Long positions may be opened after a breakout above the 48,873.9 level, targeting 49,800.0, with a stop-loss at 48,500.0.
Scenario
| Timeframe | Weekly |
| Recommendation | SELL STOP |
| Entry point | 48,316.5 |
| Take Profit | 47,450.6 |
| Stop Loss | 48,800.0 |
| Key levels | 47,450.6, 47,719.8, 48,115.8, 48,316.9, 48,873.9, 49,200.0, 49,500.0, 49,800.0 |
Alternative scenario
| Recommendation | BUY STOP |
| Entry point | 48,873.9 |
| Take Profit | 49,800.0 |
| Stop Loss | 48,500.0 |
| Key levels | 47,450.6, 47,719.8, 48,115.8, 48,316.9, 48,873.9, 49,200.0, 49,500.0, 49,800.0 |
