

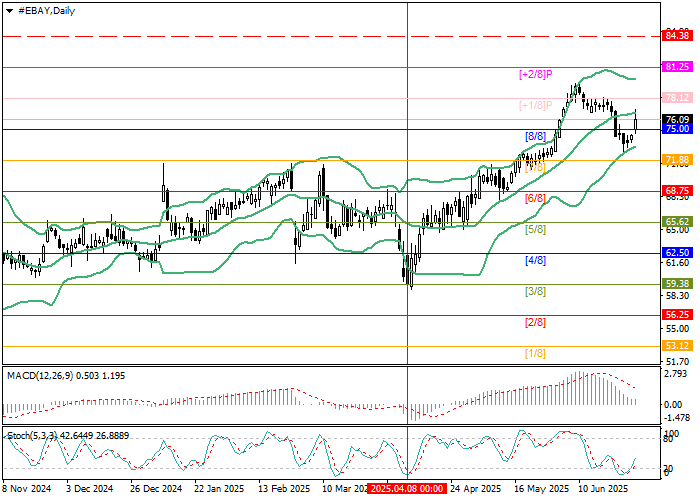
eBay Inc. shares, a benchmark in global e-commerce, have reignited their rally within a long-term bullish trend, posting gains for a fourth consecutive month. Since rebounding from the $59.38 Murray level ([3/8]), the stock price has confidently secured ground above $75.00 ([8/8]), reinforcing bullish sentiment. With momentum intact, a further move toward $81.25 ([+2/8]) and $84.38 ([+2/8], H4) remains on the table. For bears, the critical pivot sits at $71.88 ([7/8]), reinforced by the lower Bollinger Band—should this support fail, a trend reversal could trigger a retreat toward $65.62 ([5/8]) and $62.50 ([4/8]).
Technical signals support this upside bias: Bollinger Bands are expanding upward, Stochastic oscillators are moving north, and MACD remains firm in positive territory. Such confluence suggests that buyers maintain control for now, with upward targets in focus unless key supports break.
Key Support and Resistance Levels
- Resistance: $81.25, $84.38
- Support: $71.88, $65.62, $62.50
Trading Scenarios
- Bullish Scenario (Primary): Consider long positions from $76.80 with targets at $81.25 and $84.38; set stop-loss at $73.70. Suggested holding period: 5–7 days.
- Bearish Scenario (Alternative): Short positions may be opened below $71.88, aiming for $65.62 and $62.50 with stop-loss at $74.60.
| Scenario | Timeframe | Recommendation | Entry Point | Take Profit | Stop Loss | Key Levels |
|---|---|---|---|---|---|---|
| Bullish | Weekly | BUY STOP | $76.85 | $81.25, $84.38 | $73.70 | $62.50, $65.62, $71.88, $81.25, $84.38 |
| Bearish (Alt.) | Weekly | SELL STOP | $71.85 | $65.62, $62.50 | $74.60 | $62.50, $65.62, $71.88, $81.25, $84.38 |