

On Tuesday at 22:30 (GMT+2), the American Petroleum Institute (API) will release fuel inventory data, with expectations of continued builds after last week’s 1.5M barrel increase. On Thursday at 16:30 (GMT+2), the U.S. Energy Information Administration (EIA) will publish official reserves data, which previously showed a 3.036M barrel rise. Analysts anticipate another increase of at least 0.5M barrels.
Support and Resistance Levels
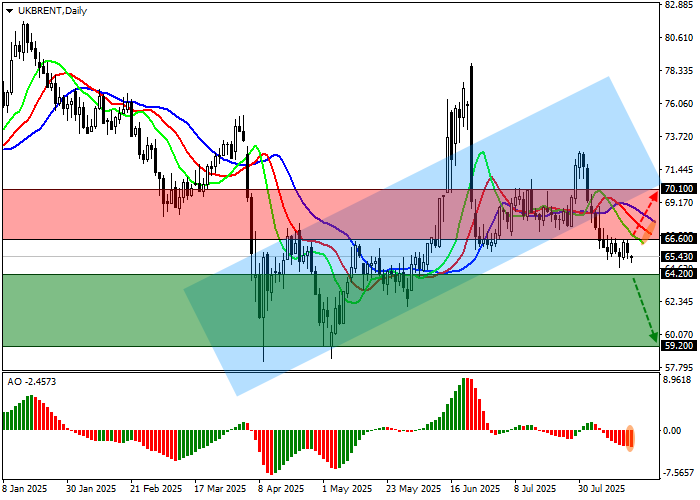
On the daily chart, the instrument is moving away from the support line of the ascending channel, with dynamic boundaries between 78.00–68.00, in a stable corrective wave.
Technical indicators confirm the sell signal: the Alligator’s fast EMA lines remain below the signal line, while the AO histogram forms negative corrective bars.
Resistance levels: 66.60, 70.10.
Support levels: 64.20, 59.20.
Trading Scenarios
Short positions are preferable after a breakdown below 64.20, with a target of 59.20. Stop-loss at 66.00. Timeframe: 7 days or more.
Long positions become relevant after a breakout above 66.60, targeting 70.10. Stop-loss at 65.00.
Scenario
- Timeframe: Weekly
- Recommendation: SELL STOP
- Entry Point: 64.20
- Take Profit: 59.20
- Stop Loss: 66.00
- Key Levels: 59.20, 64.20, 66.60, 70.10
Alternative Scenario
- Recommendation: BUY STOP
- Entry Point: 66.60
- Take Profit: 70.10
- Stop Loss: 65.00
- Key Levels: 59.20, 64.20, 66.60, 70.10
