

From a financial standpoint, ExxonMobil's Q2 results narrowly beat consensus on revenue ($81.50B vs. $80.78B expected), though this still marked a sharp decline compared to the $93.06B reported a year earlier. Earnings per share (EPS) came in at $1.64, up from $1.56 in Q1, but significantly lower than the $2.14 posted in Q2 2024.
The board has approved a quarterly dividend of $0.99 per share, payable on September 10. This implies a forward yield of roughly 3.72%, below the sector average of 5.37%, reflecting both payout stability and the pressure from declining free cash flow.
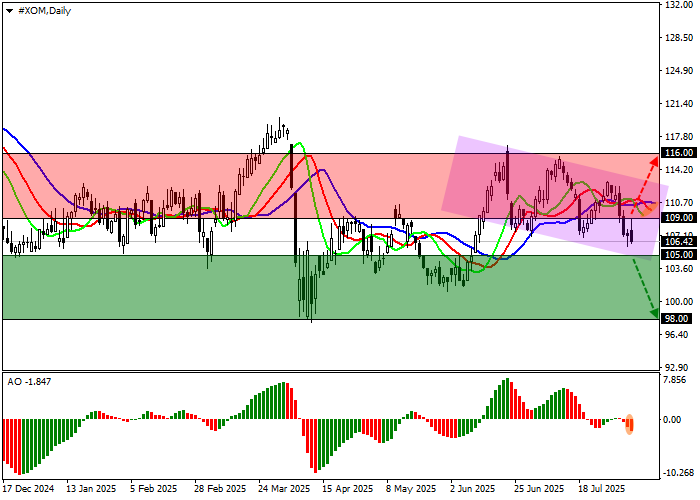 XOM tests key support as bearish pattern develops
Technically, XOM has slipped beneath the neckline of a multi-month triple-top reversal, with support and resistance bands now clearly defined between $113.00 and $104.00. Momentum indicators have recently turned negative: the Alligator’s fast EMAs diverge sharply from the signal line, while the Awesome Oscillator (AO) histogram prints a series of bearish bars, reinforcing the downside bias.
Key Support and Resistance Levels
- Support: $105.00, $98.00
- Resistance: $109.00, $116.00
Trading Scenarios
- Bearish Scenario: If price closes below $105.00, short positions targeting $98.00 become viable, with a stop loss at $108.00. Time horizon: 7+ days.
- Bullish Scenario: If XOM breaks and holds above $109.00, longs may be considered with a target at $116.00 and a stop at $106.00.
Outlook: With macro headwinds persisting and technical patterns deteriorating, ExxonMobil shares remain vulnerable to further correction. Key levels should be monitored closely for confirmation of a trend reversal or a deeper breakdown.