

On Friday, the U.S. government eased sanctions on Venezuela’s hydrocarbon sector by issuing two general licenses that allow certain energy companies to manage production projects within OPEC or hold talks to attract investment, triggering a search for potential operators of oil fields. One of the first candidates mentioned was ExxonMobil Corp., whose CEO Darren Woods has already held preliminary consultations with President Donald Trump at the White House. Previously, management’s stance on Venezuelan assets was described as cautious due to regulatory risks, sanctions constraints, and a high degree of political uncertainty, which negatively affected the investment appeal of such projects in terms of profitability. However, under the current conditions, this approach may change. Venezuela holds some of the world’s largest proven reserves, but their commercial development is constrained by infrastructure issues and the sanctions regime. If restrictions are eased, participation by U.S. corporations could support a recovery in production and a partial normalization of export flows. A significant share of fuel from the region, after refining and trading operations, is supplied to external markets, including the European Union, generating a price premium driven by logistics costs, shortages of heavy crude grades, and geopolitical factors.
On January 30, the company released its fourth-quarter financial results: revenue totaled $82.31 billion, down from $85.29 billion previously and $83.43 billion in the same period last year, while earnings per share (EPS) stood at $1.71 compared with $1.88 and $1.67, respectively. The second indexed quarterly dividend payment will be made on March 10, with the shareholder register closing on February 12. Investors will receive $1.03 per share; including the annual increase, the dividend yield reaches 2.65%, still below the sector average of 4.94%.
Support and Resistance Levels
On the daily chart, the instrument is approaching the previously broken resistance line of an ascending channel with dynamic boundaries at 132.00–118.00.
Technical indicators are weakening the buy signal: the AO histogram is forming corrective bars, while the fast EMAs of the Alligator indicator remain above the signal line.
Resistance levels: 155.00, 165.00.
Support levels: 144.00, 132.00.
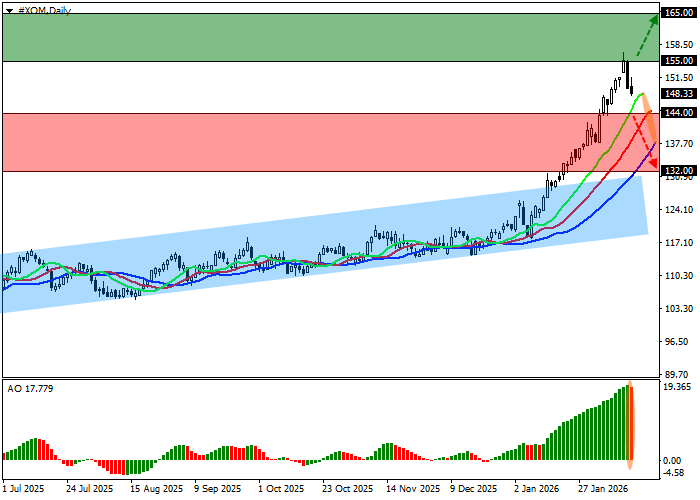
Trading Scenarios and ExxonMobil Price Forecast
Long positions may be opened after price growth and consolidation above the 155.00 level with a target at 165.00. Stop-loss — 148.00. Time horizon: 7 days or more. Short positions may be opened after a decline and consolidation below 144.00 with a target at 132.00 and a stop-loss at 152.00.
Scenario
| Timeframe | Weekly |
| Recommendation | BUY STOP |
| Entry Point | 155.05 |
| Take Profit | 165.00 |
| Stop Loss | 148.00 |
| Key Levels | 132.00, 144.00, 155.00, 165.00 |
Alternative Scenario
| Recommendation | SELL STOP |
| Entry Point | 143.95 |
| Take Profit | 132.00 |
| Stop Loss | 152.00 |
| Key Levels | 132.00, 144.00, 155.00, 165.00 |
