
The latest financial results support this bullish outlook: quarterly revenue rose from $8.22 billion to $10.15 billion, outpacing the consensus estimate of $9.54 billion. Earnings per share (EPS) climbed from $1.49 to $1.66, significantly above the $1.20 forecast—marking a post-spin-off record for the company. On July 25, GE paid its second consecutive increased quarterly dividend, $0.36 per share (up from $0.28 previously), reflecting a yield of 0.58%, which remains below the sector average of 1.00%.
Technical Picture
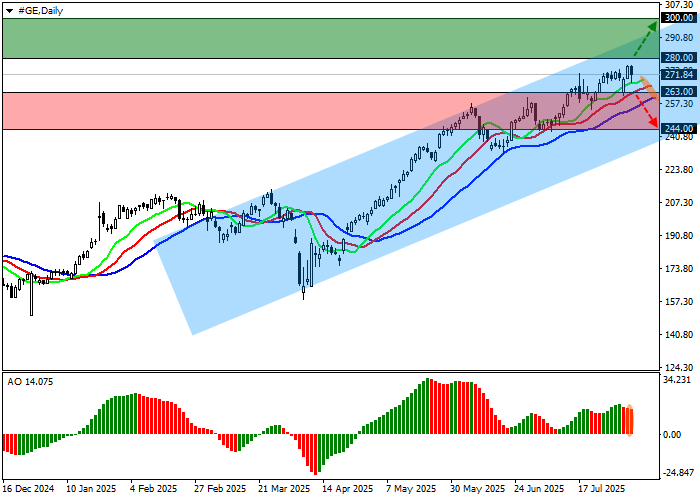
On the daily chart, GE shares have broken above the previous annual high of $270.00, reaching a new peak at $276.00. Technical indicators reinforce the buy signal: the fast EMAs of the Alligator indicator are diverging from the signal line, and the AO histogram is printing rising green bars in positive territory.
- Resistance: 280.00, 300.00
- Support: 263.00, 244.00
Trading Scenarios
- Buy Stop: Enter above 280.00, target 300.00, stop loss at 270.00. Timeframe: 7+ days.
- Sell Stop (Alternative): Enter below 263.00, target 244.00, stop loss at 270.00.
- Key Levels: 244.00, 263.00, 280.00, 300.00