

According to management forecasts, the partnership is expected to have a positive impact on earnings as early as the fourth quarter of 2025. Adjusted earnings per share are projected to increase by approximately $0.20 over the next year. Revenue is expected to rise to around $24.14 billion from $23.99 billion, while earnings per share (EPS) may reach $2.53—below the previous quarter’s $2.80, but still well above the $2.02 reported a year earlier. Against this backdrop, analysts at RBC Capital raised their price target for Johnson & Johnson shares from 209.00 to 230.00, maintaining an “outperform” rating.
The company’s most recent dividend was paid on December 9 at $1.30 per share, implying a yield of about 2.52%, slightly above the sector average of 2.49%. The date of the next dividend payment has not yet been announced, but investors can already expect a similar payout of $1.30 per share, corresponding to a potential yield of roughly 2.50–2.80%.
Support and Resistance Levels
On the daily chart, the instrument is approaching the resistance line of an ascending channel with dynamic boundaries at 220.00–200.00.
Technical indicators are slowing their previous buy signal: the fast EMAs within the Alligator indicator remain slightly above the signal line, while the Awesome Oscillator histogram is forming corrective bars.
Support levels: 204.00, 193.00.
Resistance levels: 211.00, 222.00.
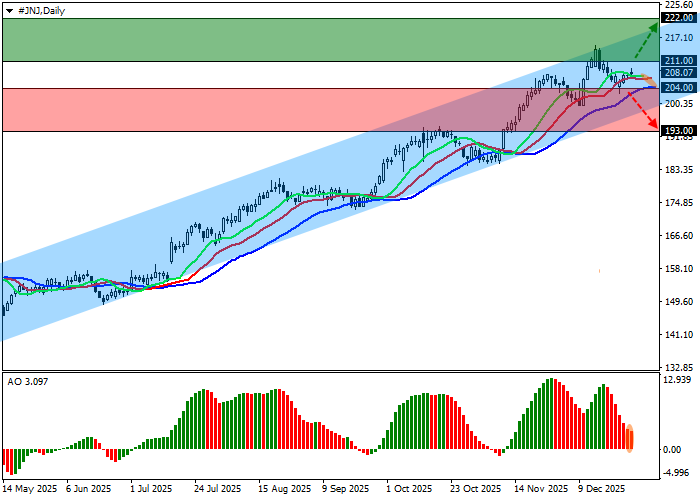
Trading Scenarios and Johnson & Johnson Price Forecast
Long positions may be considered after a confirmed breakout above the 211.00 resistance level, with a target at 222.00 and a stop-loss at 205.00. Time horizon: 7 days or longer.
Short positions may be opened after a sustained move below the 204.00 support level, targeting 193.00, with a stop-loss at 210.00.
