

October labor market data, which showed a decline of 105.0 thousand jobs in the non-farm sector, had little impact on the stance of the U.S. Federal Reserve and investors, as the November report pointed to a rebound in employment by 52.0 thousand. December forecasts suggest that labor shortages could be largely offset before the end of the year.
In addition, preliminary business activity data proved weak. The services PMI fell from 54.1 points to 52.9 points in December, versus expectations of 54.0 points, while the manufacturing PMI slipped from 52.2 points to 51.8 points, compared with forecasts of 52.0 points. Against this backdrop, the composite index reflecting activity in the two largest sectors may decline from 54.2 points to 53.0 points.
The bond market continues to see a corrective trend. The yield on 1-year U.S. Treasuries rose to 3.544%, up from 3.512% on Monday, while the 10-year yield eased to 4.168% from 4.192% last week. Yields on 20-year bonds declined to 4.795% from 4.823%, and on 30-year bonds to 4.843% from 4.856%.
Top gainers within the index include Comcast Corp. (+5.39%), Strategy Inc. (+3.34%), Tesla Inc. (+3.07%), Palantir Technologies Inc. (+2.46%), and Constellation Energy Corp. (+2.38%).
Among the main losers are Baker Hughes Co. (–3.99%), Diamondback Energy Inc. (–3.25%), Warner Bros. Discovery Inc. (–2.73%), Xcel Energy Inc. (–2.63%), and Arm Holdings ADR (–2.63%).
Support and Resistance Levels
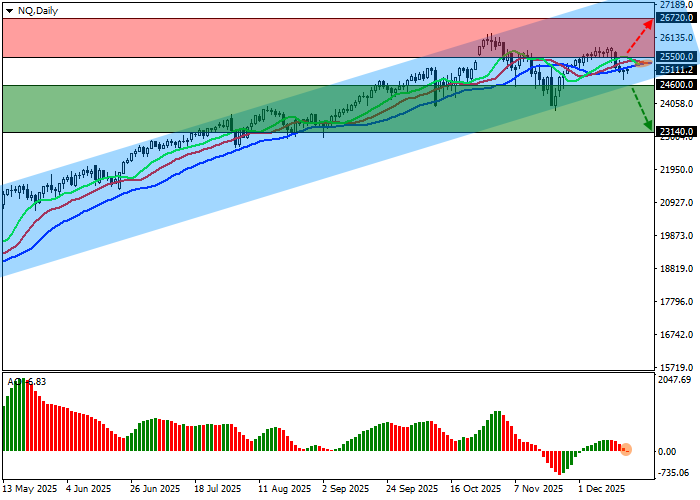
On the daily chart, prices continue to correct, attempting to approach the support line of the ascending channel with boundaries at 27,500.0–24,000.0.
Technical indicators have almost reversed and are generating a fresh sell signal: the fast EMAs in the Alligator indicator remain slightly above the signal line, while the AO histogram is forming new corrective bars and approaching the zero line.
Support levels: 24,600.0, 23,140.0.
Resistance levels: 25,500.0, 26,720.0.
Trading Scenarios and NQ 100 Forecast
If a reversal develops and the corrective decline continues, with the price consolidating below the 24,600.0 support level, short positions may be considered with a target at 23,140.0. Stop-loss: 25,100.0. Time horizon: 7 days or longer.
If the upward move resumes and the price consolidates above 25,500.0, long positions may be opened with a target at 26,720.0. Stop-loss: 25,200.0.
Scenario
| Timeframe | Weekly |
| Recommendation | SELL STOP |
| Entry Point | 24,600.0 |
| Take Profit | 23,140.0 |
| Stop Loss | 25,100.0 |
| Key Levels | 23,140.0, 24,600.0, 25,500.0, 26,720.0 |
Alternative Scenario
| Recommendation | BUY STOP |
| Entry Point | 25,500.0 |
| Take Profit | 26,720.0 |
| Stop Loss | 25,200.0 |
| Key Levels | 23,140.0, 24,600.0, 25,500.0, 26,720.0 |
