Volkswagen AG stock is trading around 103.00. Investors remain cautious as U.S. import tariffs of 15% on European vehicles weigh heavily on earnings, up sharply from the previous 2.5%. While lower than the proposed 25%, the measure still hits a core revenue stream for German automakers. President Donald Trump has also threatened further sanctions if the EU delays energy and defense purchases from the U.S.
Management projects first-half losses near €1.5 billion, forcing a downgrade in full-year sales and revenue guidance. The Q2 report confirmed the strain: revenue slipped from €83.34 billion last year to €80.81 billion, while EPS dropped from €6.21 to €4.34.
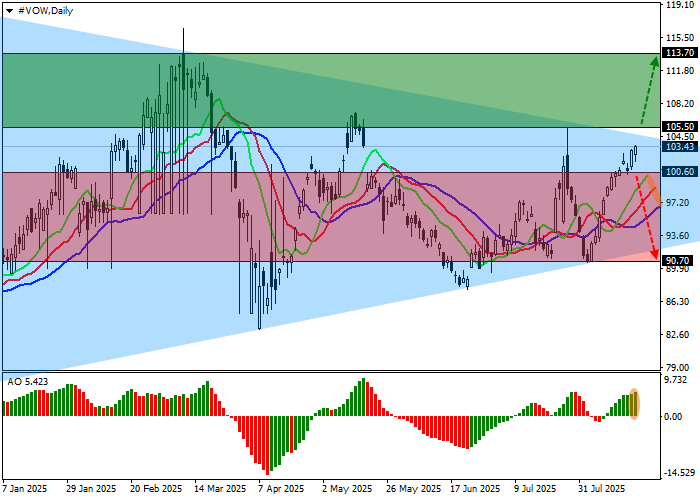
Technical picture
On the daily chart, the stock is attempting to consolidate above the 105.00 triangle resistance line. Technical indicators are leaning bullish: fast EMAs of the Alligator indicator stay above the signal line, widening the gap, and the Awesome Oscillator histogram remains positive despite mild correction bars.
- Resistance: 105.50, 113.70
- Support: 100.60, 90.70
Trading plans
Long setup: Buy after a confirmed breakout above 105.50, targeting 113.70 with a stop at 102.00. Horizon: 7+ days.
Short setup: Sell below 100.60 targeting 90.70, stop at 104.00.
Scenario
Timeframe: Weekly
Recommendation: BUY STOP
Entry: 105.50
Take Profit: 113.70
Stop Loss: 102.00
Key levels: 90.70, 100.60, 105.50, 113.70
Alternative scenario
Recommendation: SELL STOP
Entry: 100.60
Take Profit: 90.70
Stop Loss: 104.00
Key levels: 90.70, 100.60, 105.50, 113.70
Forex Analyst & Educator
Sagar Dua has been associated with financial markets since his college days. He was pursuing a postgraduate degree in Commerce in 2018 when he started honing his skills at chart analysis and slowly mastered the art of fundamental principles as well as technical analysis.
Finance took him to academia and he ended up as an Assistant Professor at a public university sharing business students for one year. Eventually, Sagar passionately mentors newbie traders and investors by conducting several seminars and webinars on his expertise about the Forex market. Apart from financial acumen, motivational speaking runs in his veins to inspire people towards success in trading and finance