

Elevated tensions persist in the Middle East, remaining the key driver of market uncertainty despite statements by U.S. President Donald Trump about his intention to continue negotiations with Iran even as both sides exchange strikes, including attacks on communications infrastructure near the Strait of Hormuz and on facilities in Kuwait and Bahrain. These incidents resulted in damage to a U.S. military base and an airport building, increasing the risk that the conflict could expand beyond a bilateral confrontation and raising the probability of Gulf countries being drawn into a broader escalation. Against this background, domestic political dynamics in the United States are becoming especially important: the House of Representatives approved a resolution aimed at prohibiting the president from continuing military action against Iran without congressional approval. The document was supported by 215 lawmakers from both parties, including four Republicans, which ensured its passage and signaled support for limiting executive authority in foreign military decisions. Overall, this creates additional institutional constraints for the White House and adds uncertainty to the possible escalation trajectory, as it increases the risk of slowing or blocking such military operations without approval from the legislative branch. On Wednesday, Trump stressed that the Strait of Hormuz would be opened “immediately” once Iran signs a memorandum on the cessation of hostilities. He added that some sections of this key waterway would require demining but urged against exaggerating the threat to commercial shipping.
As for inventory data, the American Petroleum Institute report showed a correction of –6.750 million barrels after –2.800 million barrels a week earlier, while similar data from the U.S. Energy Information Administration, after a decline of 3.327 million barrels the previous week, fell by another 7.974 million barrels. As a result, the figure now stands at 433.7 million barrels, which is 3.0% below the five-year average.
Regarding investment demand, trading activity stabilized noticeably at the end of last month and is now holding near the peak levels recorded in late May. According to statistics from the Chicago Mercantile Exchange, 843.0K futures contract positions and 167.0K options contract positions were traded on Wednesday.
Support and resistance levels
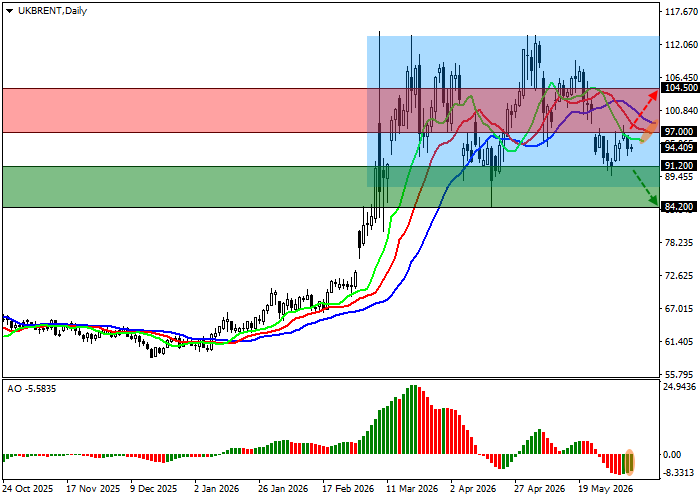
On the daily chart, the price has returned to the area of lows located slightly above the support line of the local sideways channel with boundaries at 113.00–88.00.
Technical indicators point to the continuation of the sell signal: the fast EMAs of the Alligator indicator are fixed below the signal line and moving away from it, while the AO histogram, which has long been in the negative zone, is forming new corrective bars there.
Support levels: 91.20, 84.20.
Resistance levels: 97.00, 104.50.
Brent Crude Oil trading scenarios and forecast
Short positions may be opened after the price consolidates below 91.20, with a target at 84.20. Stop-loss — 94.00. Expected timeframe: 7 days or more.
Long positions may be opened after the price consolidates above 97.00, with a target at 104.50. Stop-loss — 94.00.
Scenario
| Timeframe | Weekly |
| Recommendation | SELL STOP |
| Entry point | 91.15 |
| Take Profit | 84.20 |
| Stop Loss | 94.00 |
| Key levels | 84.20, 91.20, 97.00, 104.50 |
Alternative scenario
| Recommendation | BUY STOP |
| Entry point | 97.05 |
| Take Profit | 104.50 |
| Stop Loss | 94.00 |
| Key levels | 84.20, 91.20, 97.00, 104.50 |
