

The US military operation against Iranian infrastructure has continued for more than a week, while Tehran has responded with a series of missile and drone strikes against facilities in Persian Gulf states. At the same time, conditions in the Strait of Hormuz, a critical waterway that previously handled a significant share of global liquefied natural gas exports, have deteriorated sharply. As of July 17, daily commercial traffic had fallen to only three vessels, representing less than 3.0% of the previously recorded average. No supertankers or large LNG carriers passed through the strait for a second consecutive day, substantially increasing the risk of disruption to the global energy balance. The sharp decline in shipping activity has increased the geopolitical risk premium in oil prices. Brent Crude Oil gained more than 14.0% over the week and moved back above $80.0 per barrel, inevitably raising transportation, production and logistics costs and creating risks of renewed consumer inflation. As a result, markets are revising expectations for the future trajectory of US Federal Reserve monetary policy, contributing to higher Treasury yields and a stronger Dollar. Nevertheless, pressure on precious metals remained limited due to mixed macroeconomic data. The annual consumer price index fell from 4.2% to 3.5% in June. However, producer price and retail sales data released a day later, together with comments from monetary officials, confirmed their readiness to take restrictive measures if economic conditions require them. Therefore, despite the gradual slowdown in inflation, the regulator continues to prioritise price stability, viewing the risks of premature monetary easing as more significant than a potential slowdown in business activity. Further evidence of easing price pressure came from June producer price data: the annual figure declined to 5.5% from 6.0% a month earlier, while the consensus forecast had suggested 6.2%. May’s figure was also revised lower, strengthening the case for a gradual normalisation of inflation. On a monthly basis, the indicator slowed to 0.3%, while the core measure, excluding the most volatile components, rose considerably less than the market expected.
Market attention last week was also focused on preliminary data from the University of Michigan. The Consumer Sentiment Index rose to 54.4 points in July, reaching its highest level since February and indicating a partial recovery in household confidence. At the same time, one-year inflation expectations fell from 4.6% to 4.2%, while the five-year measure remained near 3.3%. Despite the improvement, both indicators remain well above levels consistent with the Federal Reserve’s inflation target. This helped ease some pressure on the precious metals market and allowed gold to remain above the psychologically important level of $4,000 per ounce. Under these conditions, the potential for renewed bullish momentum will continue to depend on the balance between safe-haven demand, real US Treasury yields and expectations regarding the future direction of monetary policy, particularly in the United States.
Support and Resistance Levels
On the daily chart, the Bollinger Bands are turning horizontal. The price range is widening slightly at the upper boundary while remaining sufficiently broad for the current level of market activity. The MACD is reversing and attempting to consolidate above its signal line. The Stochastic Oscillator, meanwhile, is gradually approaching the 20 level, indicating a risk that the instrument may become oversold over the near term.
Resistance levels: 4060.00, 4121.69, 4179.79, 4245.06.
Support levels: 4000.00, 3943.66, 3880.00, 3830.00.
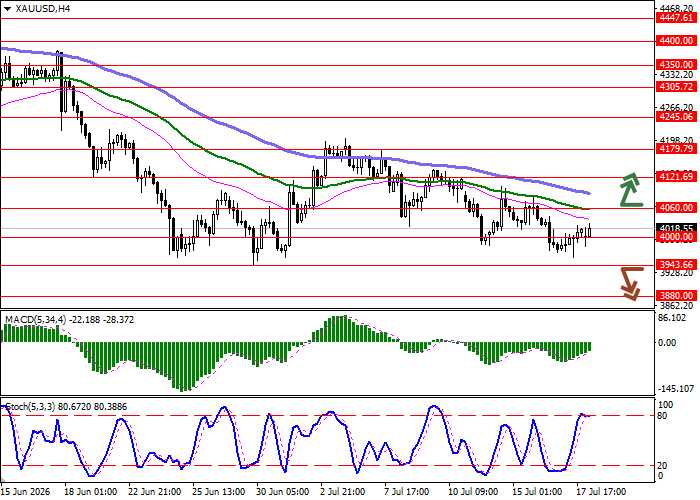
XAU/USD Trading Scenarios and Forecast
Long positions may be opened after a confident breakout above 4060.00, with a target at 4179.79. Stop-loss: 4000.00. Estimated timeframe: two to three days. A return of bearish momentum followed by a break below 3943.66 may provide a signal to open new short positions, targeting 3830.00. Stop-loss: 4000.00.
Scenario
| Timeframe | Intraday |
| Recommendation | BUY STOP |
| Entry Point | 4060.00 |
| Take Profit | 4179.79 |
| Stop Loss | 4000.00 |
| Key Levels | 3830.00, 3880.00, 3943.66, 4000.00, 4060.00, 4121.69, 4179.79, 4245.06 |
Alternative Scenario
| Recommendation | SELL STOP |
| Entry Point | 3943.66 |
| Take Profit | 3830.00 |
| Stop Loss | 4000.00 |
| Key Levels | 3830.00, 3880.00, 3943.66, 4000.00, 4060.00, 4121.69, 4179.79, 4245.06 |
