

Naturally, investors remain focused on the geopolitical conflict in the Middle East, which has escalated sharply in recent days. The parties have been actively exchanging strikes since the weekend, while US President Donald Trump announced yesterday that the naval blockade of Iran would be reinstated from July 14. According to the US Central Command, American forces carried out another series of air strikes against Iranian targets. Since the beginning of the latest escalation phase, several hundred sites have reportedly been hit, including facilities in Bushehr, Chabahar, Jask and Konarak, as well as on Abu Musa Island and in the port of Bandar Abbas. The blockade, which takes effect at 20:00 GMT on July 14, covers the entire Iranian coastline, ports and oil terminals, as well as all vessels regardless of their flag. At the same time, Trump announced Washington’s intention to impose a 20% charge on cargo passing through the Strait of Hormuz to cover security costs. Previously, however, Donald Trump had strongly criticised Tehran’s plans to charge commercial vessels for passage through the strait.
In any case, the Strait of Hormuz, through which around one-fifth of global oil and liquefied natural gas supplies normally pass, has once again become effectively blocked. Satellite monitoring data show that the number of vessels using the strategic waterway has fallen from 43 to 17 within just a few days. Iranian forces have also responded. The Islamic Revolutionary Guard Corps launched strikes against US facilities in Kuwait, hit a vessel in the Strait of Hormuz with cruise missiles, while the United Arab Emirates reported attacks on two of its tankers in Omani waters. Iran’s senior military command stated that it would not allow Washington to interfere in the management of the strait and that any attempt by the United States to pass through without permission would be met with force.
On Tuesday, July 14, investors are also focused on key US consumer inflation data for June. Current forecasts suggest that the headline annual inflation rate may slow from 4.2% to 3.8%, while the monthly reading could decline by 0.1% for the first time in a considerable period following a 0.5% increase in May. The core index, excluding food and energy prices, is expected to remain unchanged at 2.9% year-on-year and 0.2% month-on-month. In addition, the American Petroleum Institute (API) is due to publish its report on oil inventory changes for the week ending July 10. The previous report showed a modest decline in commercial crude inventories of 0.399 million barrels. On Wednesday, July 15, the US Energy Information Administration (EIA) will release its final inventory report. The previous EIA report showed that commercial crude inventories increased by 300 thousand barrels to 4.114 billion barrels, while gasoline and distillate stocks fell significantly by 190.4 thousand and 498 thousand barrels, respectively.
Support and resistance levels
The Bollinger Bands indicator on the daily chart is turning upwards. The price range is expanding, although it is still lagging behind the recent surge in bullish sentiment.
The MACD indicator is rising and continues to provide a strong buy signal, with the histogram remaining above the signal line.
The Stochastic oscillator is showing similar dynamics but is trading close to its maximum values, indicating a risk that the instrument may become overbought in the ultra-short term.
Resistance levels: 79.24, 81.00, 83.00, 85.00.
Support levels: 78.00, 76.00, 74.00, 72.33.
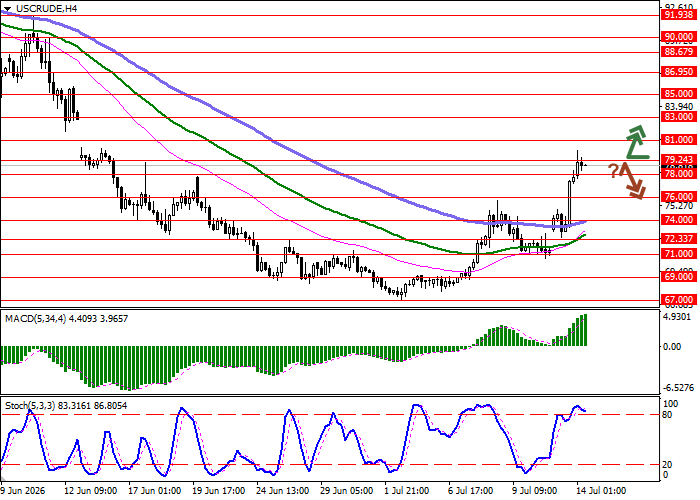
WTI Crude Oil Trading Scenarios and Price Forecast
Long positions may be opened after a confident breakout above 79.24 with a target at 83.00. Stop-loss — 77.00. Implementation period: 1–2 days.
A rebound from 79.24 as resistance followed by a break below 78.00 may provide a signal to open new short positions with a target at 74.00. Stop-loss — 79.50.
Scenario
| Timeframe | Intraday |
| Recommendation | BUY STOP |
| Entry point | 79.30 |
| Take Profit | 83.00 |
| Stop Loss | 77.00 |
| Key levels | 72.33, 74.00, 76.00, 78.00, 79.24, 81.00, 83.00, 85.00 |
Alternative Scenario
| Recommendation | SELL STOP |
| Entry point | 77.95 |
| Take Profit | 74.00 |
| Stop Loss | 79.50 |
| Key levels | 72.33, 74.00, 76.00, 78.00, 79.24, 81.00, 83.00, 85.00 |
