

In response, U.S. armed forces struck infrastructure facilities on Qeshm Island, located in the Strait of Hormuz. According to media reports, an additional escalation factor may have been an attack on the M/T Lexie oil tanker flying the flag of Botswana, which was heading toward Kharg Island in the Persian Gulf. In addition, tensions are being aggravated by the ongoing blockade of maritime traffic linked to Iranian ports, which has been in place since April 13: according to published data, six vessels have been disabled during this period and another 122 have been redirected. However, this week, U.S. President Donald Trump said in an interview with ABC News that, in his opinion, the parties could reach agreements on restoring shipping through the strategically important waterway as early as next week, although several key issues, primarily the nuclear issue, still need to be resolved before a deal can be concluded.
Nevertheless, Iran’s Supreme Leader Mojtaba Khamenei issued a decree banning the export of highly enriched uranium from the country. The decision was made against the backdrop of demands from the Republican administration, which insisted on transferring the stockpiles of this material abroad. The matter concerns approximately 440.0 kg of uranium enriched to 60.0%.
Kazakhstan was among the latest countries to express readiness to provide technical assistance in resolving the issue of Iran’s nuclear program. The country already hosts a low-enriched uranium bank created under the auspices of the International Atomic Energy Agency, meaning it has the infrastructure for safe storage. Recent events have significantly worsened the prospects for reaching a compromise. Market participants are becoming increasingly cautious in assessing the likelihood of a quick settlement, while some analysts do not rule out further local escalation that could develop into a resumption of full-scale hostilities.
As for interim factors, the American Petroleum Institute previously reported a decline in crude oil inventories by 6.750 million barrels after a correction of –2.800 million barrels, while the U.S. Energy Information Administration recorded a decrease of 7.974 million barrels the day before, following –3.327 million barrels previously.
Regarding investment demand for oil contracts, data from leading exchanges show that trading volumes remain stable, which is quite logical given the continued blockade of the Strait of Hormuz and unclear prospects for resolving the Middle East crisis. The Chicago Mercantile Exchange recorded 713.0K positions traded in futures on June 2, which is an average level comparable to the data from the end of last month, while options positions reached 138.0K — the average May level. The U.S. Commodity Futures Trading Commission reports a similar dynamic: 161.0K net speculative positions versus 172.6K a week earlier.
Support and resistance levels
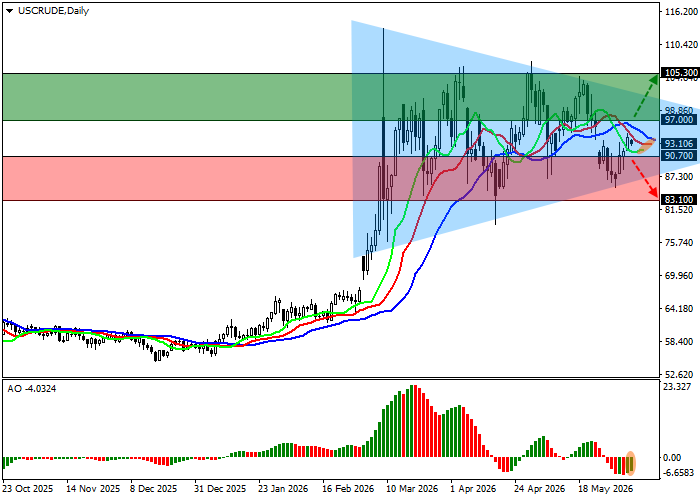
On the daily chart, the instrument is fixed slightly above the support line of the triangle pattern with boundaries at 101.00–86.00.
Technical indicators have not yet reversed and are maintaining an unstable sell signal: the fast EMAs on the Alligator indicator are slightly below the signal line, while the AO histogram is forming new corrective bars, holding near the transition level.
Support levels: 90.70, 83.10.
Resistance levels: 97.00, 105.30.
WTI Crude Oil trading scenarios and forecast
Long positions may be opened after the price consolidates above 97.00, with a target at 105.30. Stop-loss — 94.00. Expected timeframe: 7 days or more.
Short positions may be opened after the price consolidates below 90.70, with a target at 83.10. Stop-loss — 93.00.
Scenario
| Timeframe | Weekly |
| Recommendation | BUY STOP |
| Entry point | 97.05 |
| Take Profit | 105.30 |
| Stop Loss | 94.00 |
| Key levels | 83.10, 90.70, 97.00, 105.30 |
Alternative scenario
| Recommendation | SELL STOP |
| Entry point | 90.65 |
| Take Profit | 83.10 |
| Stop Loss | 93.00 |
| Key levels | 83.10, 90.70, 97.00, 105.30 |
