

The ceasefire expires on April 22, while signals from the opposing sides remain contradictory. A second round of talks was scheduled to take place yesterday in Islamabad, Pakistan, but Iranian authorities refused to participate because of the White House blockade on Iranian maritime shipping. Nevertheless, Reuters sources report that the meeting will still take place tomorrow. On the eve of this, US President Donald Trump said in an interview with Bloomberg that if no compromise with Tehran is reached, missile attacks could resume as early as Wednesday. Thus, given the geopolitical instability, investors prefer to remain cautious, although most still hope for a peaceful resolution to the standoff, which explains the prevailing downward trend in prices.
Otherwise, prices could face a significant increase due to supply disruptions. A physical shortage of hydrocarbons caused by the blockade of the Strait of Hormuz has now persisted for a second month. This has been partially offset by the release of 400.0 million barrels from strategic reserves by members of the International Energy Agency (IEA), as well as by the redirection of 25.0% of Persian Gulf production from maritime shipping to pipeline transport. However, that will not be enough to cover current demand, since, according to IEA Executive Director Fatih Birol, the market is now facing the largest fuel crisis in history.
The asset may receive local support from the publication of the weekly crude oil inventory report by the American Petroleum Institute (API) at 22:30 (GMT+2): according to preliminary estimates, the indicator is expected to decline from 6.1 million barrels to –1.0 million barrels.
Support and resistance levels
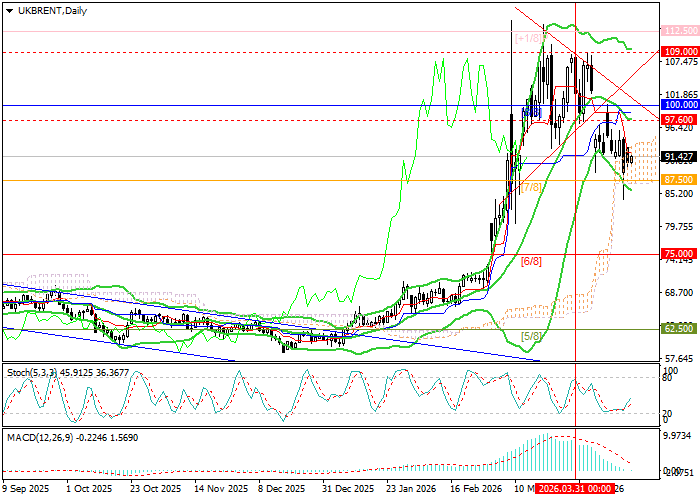
The trading instrument is attempting to form a downward trend, as confirmed by the downward reversal of the Bollinger Bands and the MACD histogram preparing to move into negative territory. After a break below 87.50 (Murray [7/8]), a move toward 75.00 (Murray [6/8]) and 62.70 (Murray [5/8]) is expected. However, if the price breaks above the middle Bollinger Band at 97.60, growth may resume toward 109.00 and 112.50 (Murray [+1/8]).
Overall, a continuation of the negative trend appears more likely in the near term, although much will depend on further geopolitical developments.
Resistance levels: 97.60, 109.00, 112.50.
Support levels: 87.50, 75.00, 62.50.
Trading scenarios and Brent Crude Oil forecast
Short positions may be opened below 87.50 with targets at 75.00 and 62.50, and a stop-loss at 95.00. Timeframe for implementation: 5–7 days.
Long positions may be opened above 97.60 with targets at 109.00 and 112.50, and a stop-loss at 92.00.
Scenario
| Timeframe | Weekly |
| Recommendation | SELL STOP |
| Entry Point | 87.45 |
| Take Profit | 75.00, 62.50 |
| Stop Loss | 95.00 |
| Key Levels | 62.50, 75.00, 87.50, 97.60, 109.00, 112.50 |
Alternative Scenario
| Recommendation | BUY STOP |
| Entry Point | 97.65 |
| Take Profit | 109.00, 112.50 |
| Stop Loss | 92.00 |
| Key Levels | 62.50, 75.00, 87.50, 97.60, 109.00, 112.50 |
