

An additional factor behind the positive momentum, according to analysts, is the completion of the company’s acquisition of Simpl Automation Inc., which specializes in warehouse automation. Its solutions had previously been tested in one of the company’s stores in Georgia: the results of the new storage and retrieval systems satisfied The Home Depot Inc. management, after which the deal was approved. The acquisition is expected to accelerate order fulfillment, reduce processing costs, and strengthen the company’s long-term profitability by improving its competitiveness under current conditions.
Overall, despite the current geopolitical tensions, analysts assess the company’s long-term prospects positively. The corporation continues to pursue a strategy of actively expanding its e-commerce business: in the fourth quarter of last year, online sales rose by 11.0%, while its e-commerce platform generated $25.0 billion in revenue. A mobile application aimed at improving shopping convenience is also expected to be launched soon. According to analysts’ calculations, the company’s active development continues to support the long-term growth outlook for shareholder returns: projected returns over the next three years stand at 21.8%, and over five years at 18.5%.
Support and resistance levels
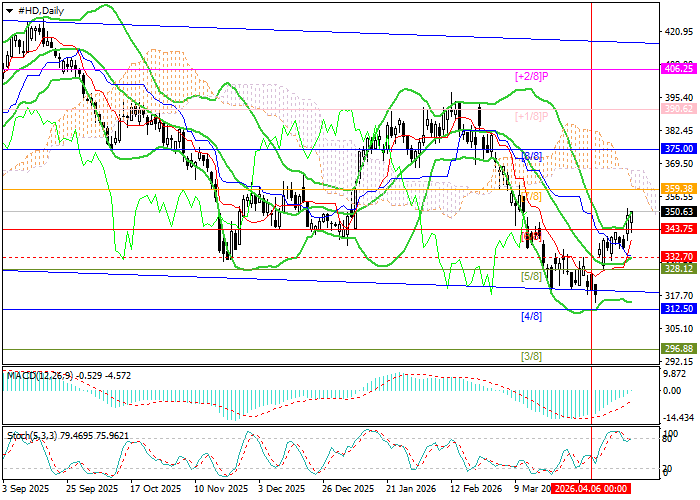
The instrument is moving within a long-term downward channel: at the beginning of the month, the price reached its lower boundary at 319.40, but failed to break below it and resumed its growth. At present, the price has consolidated above 343.75 (Murray [6/8]), which opens the way toward 375.00 (Murray [8/8]), 390.62 (Murray [+1/8]), and 406.25 (Murray [+2/8]). However, if the middle Bollinger Band at 332.70 is broken to the downside, a decline toward 312.50 (Murray [4/8]) and 296.88 (Murray [3/8]) may follow.
Technical indicators suggest that the upward movement may continue: Bollinger Bands and Stochastic are turning upward, although the latter has entered overbought territory, while the MACD histogram is preparing to move into positive territory and form a buy signal.
Resistance levels: 375.00, 390.62, 406.25.
Support levels: 332.70, 312.50, 296.88.
Trading scenarios and The Home Depot Inc. price forecast
Long positions may be opened from 352.40 with targets at 375.00, 390.62, and 406.25, and a stop-loss at 337.00. Timeframe for implementation: 5–7 days.
Short positions may be opened below 332.70 with targets at 312.50 and 296.88, and a stop-loss at 344.00.
Scenario
| Timeframe | Weekly |
| Recommendation | BUY STOP |
| Entry Point | 352.45 |
| Take Profit | 375.00, 390.62, 406.25 |
| Stop Loss | 337.00 |
| Key Levels | 296.88, 312.50, 332.70, 375.00, 390.62, 406.25 |
Alternative Scenario
| Recommendation | SELL STOP |
| Entry Point | 332.65 |
| Take Profit | 312.50, 296.88 |
| Stop Loss | 344.00 |
| Key Levels | 296.88, 312.50, 332.70, 375.00, 390.62, 406.25 |
