

Nonfarm payrolls came in at 172.0K, more than twice the consensus forecast of 85.0K, while the April figure was revised from 115.0K to 179.0K. The unemployment rate remained at 4.3%, and average hourly earnings rose by 0.3% month-on-month and 3.4% year-on-year, matching preliminary estimates. Combined employment revisions for March and April added 93.0K jobs to previous readings, resulting in the strongest three-month gain in the past two years. Economists note that the improvement in the sector is linked more to a low level of layoffs than to active hiring expansion, and that its resilience, together with uncertainty caused by the escalation of the Middle East conflict, gives the U.S. Federal Reserve grounds to maintain tight monetary policy. As a result, the yield on 10-year U.S. Treasury bonds reached 4.77%, while the probability of an interest rate hike before the end of the year rose to 70.0%, fully excluding any hints of a possible rate cut. Stronger inflation data, due later this week, would reinforce hawkish expectations: forecasts suggest that the broad consumer price index will accelerate in May from 3.8% to 4.2% year-on-year and slow from 0.6% to 0.5% month-on-month.
Meanwhile, the escalation of the U.S.–Iran confrontation continues: on Saturday, the sides again exchanged missile and drone attacks. U.S. Air Force strikes damaged coastal radar stations and destroyed two Iranian drones, while the Islamic Revolutionary Guard Corps launched seven ballistic missiles at the Ali Al Salem military base in Kuwait and the headquarters of the U.S. Navy’s Fifth Fleet in Bahrain. Six of the missiles were intercepted, while one fell short of its target. Iran’s Foreign Ministry also condemned Washington’s actions as a violation of the ceasefire terms and national sovereignty and stated its intention to defend its interests by all necessary means. Tehran’s representatives note that diplomatic negotiations have no prospects, while the White House is considering redirecting “frozen” Iranian assets to support affected allies.
Support and resistance levels
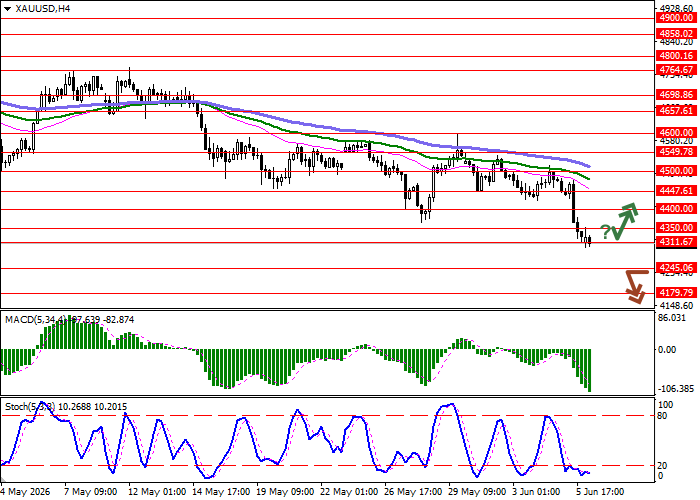
On the daily chart, Bollinger Bands are directed downward: the price range is expanding, although it is currently not keeping pace with the surge in bearish activity. The MACD indicator is declining, strengthening the sell signal as the histogram remains below the signal line, while Stochastic is consolidating below the “20” mark, indicating the likelihood that the asset is oversold in the nearest timeframes.
Resistance levels: 4350.00, 4400.00, 4447.61, 4500.00.
Support levels: 4311.67, 4245.06, 4179.79, 4060.00.
XAU/USD gold trading scenarios and forecast
Short positions may be opened after a breakout below 4245.06, with a target at 4060.00. Stop-loss — 4311.67. Expected timeframe: 2–3 days. Long positions may be opened after a rebound from 4311.67 and a breakout above 4400.00, with a target at 4500.00. Stop-loss — 4350.00.
Scenario
| Timeframe | Intraday |
| Recommendation | SELL STOP |
| Entry point | 4245.05 |
| Take Profit | 4060.00 |
| Stop Loss | 4311.67 |
| Key levels | 4060.00, 4179.79, 4245.06, 4311.67, 4350.00, 4400.00, 4447.61, 4500.00 |
Alternative scenario
| Recommendation | BUY STOP |
| Entry point | 4399.95 |
| Take Profit | 4500.00 |
| Stop Loss | 4350.00 |
| Key levels | 4060.00, 4179.79, 4245.06, 4311.67, 4350.00, 4400.00, 4447.61, 4500.00 |
