

According to data published last week, annual inflation declined from 3.2% to 2.8% in June, marking the first notable slowdown since price growth began accelerating at the start of the year. Nevertheless, the rate remains well above the regulator’s 2.0% target. Core inflation, which excludes the most volatile components such as energy, food, alcohol and tobacco, fell from 2.6% to 2.4%. At the same time, energy inflation slowed from 10.8% to 8.5%, while services inflation eased from 3.5% to 3.2%. Overall, price pressures weakened in 22 of the EU’s 27 member states, reinforcing market expectations that the ECB may pause its monetary tightening cycle. In June, the regulator raised its interest rate from 2.00% to 2.25% after eurozone inflation reached 3.2% in May, its highest level since autumn 2023. However, the main challenge for policymakers remains uncertainty surrounding the energy sector, as the factor that previously intensified inflationary pressure is once again becoming a potential source of risk. After surging at the beginning of the year, Brent crude oil prices approached $120.00 per barrel before correcting toward $72.00 following a temporary ceasefire between the United States and Iran in late June. Prices are now moving higher again. Energy-intensive industries, including metals, chemicals and automobile manufacturing, are facing the greatest pressure, as elevated resource costs are already affecting investment decisions and corporate margins. According to the central bank, returning inflation to the 2.0% target will require a prolonged period of restrictive monetary policy.
Conditions in the eurozone banking sector are adding further pressure to economic activity. According to the ECB’s latest survey, financial institutions continued to tighten lending standards in the second quarter amid geopolitical instability, elevated risks in the corporate sector and persistent uncertainty over the economic outlook. Despite rising demand from businesses, banks are imposing stricter requirements on borrowers and limiting access to financing for certain industries, particularly automobile manufacturing and energy-intensive sectors that are most sensitive to capital and raw material costs. Although the European economy is demonstrating a degree of resilience, rising energy prices could restrain consumer activity and weaken industrial performance.
Meanwhile, the US dollar is receiving support from the government bond market, with the yield on ten-year Treasuries holding around 4.6% and the thirty-year yield remaining above 5.0%. Market participants are concerned that rising oil and commodity prices could slow the disinflation process and force major central banks to maintain restrictive monetary policy for longer than previously expected. Investors are currently focused on comments from US Federal Reserve officials. Cleveland Federal Reserve Bank President Beth Hammack said yesterday that inflation remains too high and that businesses expect the Federal Open Market Committee (FOMC) to take action to address it. Dallas Fed President Lorie Logan added that current conditions require a modest increase in interest rates. Against this backdrop, the probability of monetary tightening in December has risen to 82.0%, according to the CME FedWatch Tool.
Support and resistance levels
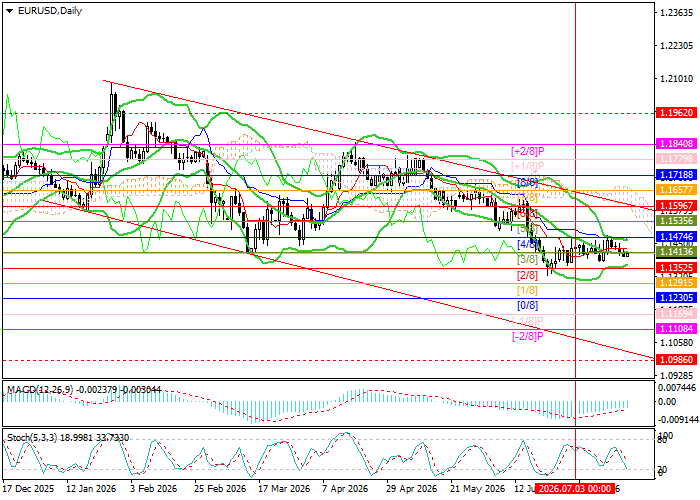
The instrument remains within a descending channel, although it has already entered the sideways range of 1.1474–1.1380. The key level for sellers remains 1.1352 (Murrey level [2/8]), which the price unsuccessfully tested last month. A confirmed breakdown below this level could allow the bears to target 1.1230 (Murrey level [0/8]), 1.1108 (Murrey level [–2/8]) and 1.0986 (Murrey level [5/8], W1). If buyers manage to break above 1.1596 (Murrey level [6/8], the upper Bollinger Band), the current trend could reverse, allowing the price to exit the descending channel through its upper boundary and subsequently test 1.1840 (Murrey level [+2/8]) and 1.1962 (Murrey level [+1/8], W1).
Technical indicators do not provide a clear signal: the Bollinger Bands are flattening, the MACD histogram remains stable in negative territory, while the Stochastic Oscillator is approaching the oversold zone and may soon reverse.
Resistance levels: 1.1596, 1.1840, 1.1962.
Support levels: 1.1352, 1.1230, 1.1108, 1.0986.
EUR/USD Trading Scenarios and Exchange Rate Forecast
Short positions may be opened below 1.1352 with targets at 1.1230, 1.1108 and 1.0986 and a stop-loss at 1.1440. Time frame: 5–7 days.
Long positions may be opened above 1.1596 with targets at 1.1840 and 1.1962 and a stop-loss at 1.1510.
Scenario
| Time frame | Weekly |
| Recommendation | SELL STOP |
| Entry point | 1.1352 |
| Take Profit | 1.1230, 1.1108, 1.0986 |
| Stop Loss | 1.1440 |
| Key levels | 1.0986, 1.1108, 1.1230, 1.1352, 1.1596, 1.1840, 1.1962 |
Alternative scenario
| Recommendation | BUY STOP |
| Entry point | 1.1596 |
| Take Profit | 1.1840, 1.1962 |
| Stop Loss | 1.1510 |
| Key levels | 1.0986, 1.1108, 1.1230, 1.1352, 1.1596, 1.1840, 1.1962 |
