
According to forecasts by TD Securities Inc., the consumer price index accelerated from 3.8% to 4.2%, the highest level since April 2023, while the core indicator rose to 2.8% year-on-year, with risks tilted to the upside, especially if aviation fuel prices turn out to be higher than expected. The final figures significantly increase the probability of tighter monetary policy from the U.S. Federal Reserve this year, which had already strengthened considerably after the publication of strong labor market data, reaching 71.0%, according to the Chicago Mercantile Exchange (CME) FedWatch Tool, fully excluding the possibility of a shift toward dovish rhetoric. For now, markets are leaning more toward an adjustment in borrowing costs in September, although the dynamics of the U.S.–Iran confrontation also have a significant impact on the regulator’s actions.
Meanwhile, in Germany, the largest economy in the eurozone, industrial production in April rose from 0.1% to 0.4%, meeting expectations. However, the May trade surplus declined from 14.7 billion euros to 14.5 billion euros against estimates of 15.0 billion euros, while the EU composite business activity index fell to 48.5 points, the lowest level since November 2024. This data also strengthens the possibility of an interest rate increase by the European Central Bank, which could implement it as early as Thursday, since last month the consumer price index reached 3.2% year-on-year and the core indicator reached 2.5%, a six-month high. Analysts note that officials are likely to hint at a subsequent pause amid the slowing economic recovery.
At the same time, the EU is considering expanding its carbon levy system by including foreign airlines, while directing the funds raised toward the development of green energy projects. This reflects an effort to strengthen climate policy and redistribute the financial burden within the aviation sector. The proposed measure may become part of a broader reform of the European Emissions Trading System (ETS), aimed at improving the effectiveness of emissions regulation and eliminating existing exemptions that have applied to international carriers since 2012. This approach points to Brussels’ intention to ensure more even participation of the entire aviation segment in financing climate initiatives, as well as to strengthen fiscal incentives for reducing the industry’s carbon footprint.
Support and resistance levels
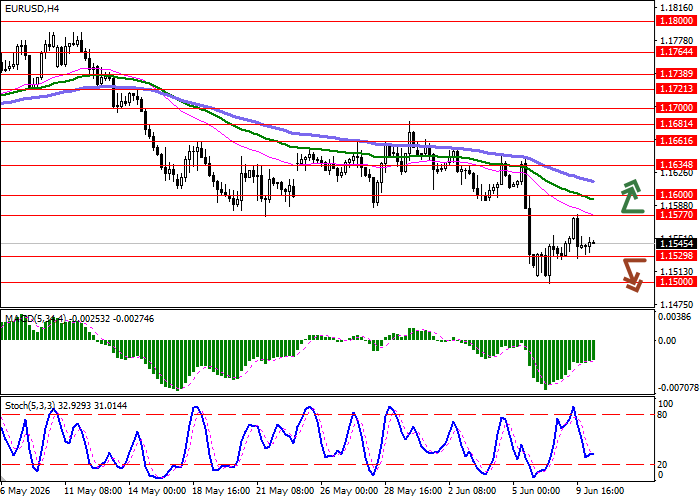
On the daily chart, Bollinger Bands are moderately declining: the price range is slowing its recent expansion amid mixed trading dynamics in the ultra-short term. The MACD indicator is turning upward, preparing to form a buy signal as the histogram is moving toward positioning above the signal line, while Stochastic is retreating from minimum values, reflecting the probability of corrective growth in the nearest timeframes.
Resistance levels: 1.1577, 1.1600, 1.1634, 1.1661.
Support levels: 1.1529, 1.1500, 1.1450, 1.1400.
EUR/USD trading scenarios and forecast
Long positions may be opened after a breakout above 1.1577, with a target at 1.1634. Stop-loss — 1.1550. Expected timeframe: 1–2 days.
Short positions may be opened after a breakout below 1.1529, with a target at 1.1450. Stop-loss — 1.1577.
Scenario
| Timeframe | Intraday |
| Recommendation | BUY STOP |
| Entry point | 1.1580 |
| Take Profit | 1.1634 |
| Stop Loss | 1.1550 |
| Key levels | 1.1400, 1.1450, 1.1500, 1.1529, 1.1577, 1.1600, 1.1634, 1.1661 |
Alternative scenario
| Recommendation | SELL STOP |
| Entry point | 1.1525 |
| Take Profit | 1.1450 |
| Stop Loss | 1.1577 |
| Key levels | 1.1400, 1.1450, 1.1500, 1.1529, 1.1577, 1.1600, 1.1634, 1.1661 |
