

Expectations for the largest EU economy suggest that the harmonized index may slow from 2.9% to 2.8% year-on-year and from 0.5% to 0.2% month-on-month, while the broader indicator is expected to decline from 2.9% to 2.8% and from 0.6% to 0.1%, respectively. If the actual data comes in above forecasts, this could strengthen the case for tighter monetary policy from the European Central Bank.
According to the minutes of the latest meeting, several members of the Governing Council were already ready to support a more hawkish tone in April. The decision to keep borrowing costs unchanged was described as “borderline,” while officials stressed that the energy crisis had proven more persistent than expected. Higher oil prices are increasing price pressure and raising the risk that elevated inflation could remain in place for longer. ECB Executive Board member Isabel Schnabel believes the central bank should raise rates in June even if the United States and Iran manage to sign a peace agreement by then, noting that the damage to energy infrastructure and global supply chains is very significant. She also emphasized that the baseline forecast already includes two monetary policy adjustments, and one rate hike may not be enough to achieve the inflation target. Market participants share this view, pricing in two future increases and a 50.0% probability of a third one over the next year. At the April meeting, the deposit rate was kept at 2.00%, the main refinancing rate at 2.15%, and the marginal lending facility rate at 2.40%.
Meanwhile, U.S. investors are focused on the Personal Consumption Expenditures price indices. The core indicator, the Federal Reserve’s preferred inflation measure, rose by 0.2% month-on-month in April, below market expectations and the previous month’s 0.3%. At the same time, the annual core reading accelerated from 3.2% to 3.3%, matching forecasts and putting pressure on the dollar, which had previously reached a seven-week high of 99.54 in the DXY index.
The U.S. economy expanded by 1.6% year-on-year in the first quarter, above the previous 0.5% but below the initial estimate of 2.0%. Initial jobless claims reached 215.0K in the latest week, exceeding expectations of 211.0K and the previous reading of 210.0K, while durable goods orders rose by 7.9% in April after a revised decline of 1.3%. Earlier, Federal Reserve Bank of Minneapolis President Neel Kashkari said that the authorities’ priority is to reduce inflation. He confirmed plans to maintain a balanced approach between price stability and full employment, stressing that consumer inflation has remained above the 2.0% target for more than five years, while the labor market remains stable.
Support and resistance levels
On the daily chart, Bollinger Bands show a moderate decline: the price range is narrowing, reflecting mixed trading dynamics in the ultra-short term. MACD is turning upward, forming a new buy signal and attempting to move above the signal line. Stochastic shows similar dynamics, with the indicator line fixed near the “80” mark, pointing to overbought risks for the euro in the ultra-short term.
Resistance levels: 1.1661, 1.1681, 1.1700, 1.1721.
Support levels: 1.1634, 1.1600, 1.1577, 1.1529.
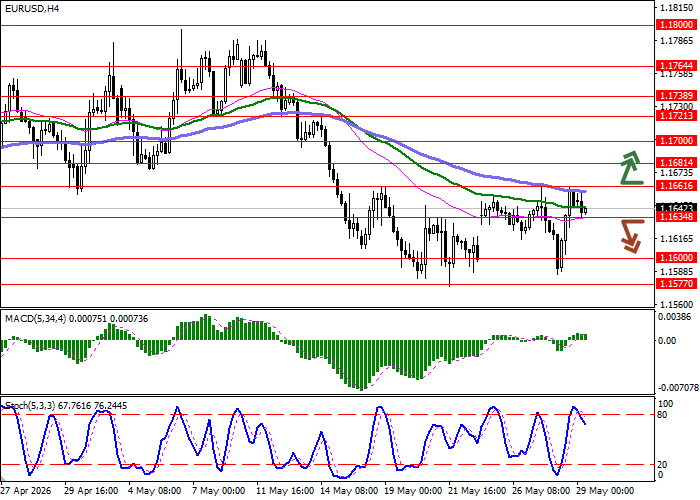
EUR/USD trading scenarios and forecast
Short positions may be opened after a confident breakout below 1.1634, with a target at 1.1577. Stop-loss — 1.1661. Expected timeframe: 1–2 days.
The development of corrective growth followed by a breakout above 1.1661 may become a signal to open long positions with a target at 1.1721. Stop-loss — 1.1634.
Scenario
| Timeframe | Intraday |
| Recommendation | SELL STOP |
| Entry point | 1.1630 |
| Take Profit | 1.1577 |
| Stop Loss | 1.1661 |
| Key levels | 1.1529, 1.1577, 1.1600, 1.1634, 1.1661, 1.1681, 1.1700, 1.1721 |
Alternative scenario
| Recommendation | BUY STOP |
| Entry point | 1.1665 |
| Take Profit | 1.1721 |
| Stop Loss | 1.1634 |
| Key levels | 1.1529, 1.1577, 1.1600, 1.1634, 1.1661, 1.1681, 1.1700, 1.1721 |
