

Despite the recent weakening of the US currency caused by significant progress in peace negotiations between the United States and Iran, the asset remains close to the historical high of 162.80, raising concerns among investors. As analysts expected, after breaking above the previous peak of 161.00, Japanese financial authorities intervened in the market by buying yen, but this did not lead to a long-term trend reversal.
Against this backdrop, analysts at The Goldman Sachs Group Inc. revised their forecasts for the pair’s further movement and concluded that the exchange rate could reach 162.00 in three months, 163.00 in six months and 165.00 within a year, all above their previous estimates. Experts justify these projections with incoming macroeconomic data suggesting a lower probability of a recession in the United States, which supports the dollar. At the same time, the Bank of Japan is not expected to raise interest rates rapidly, meaning USD/JPY may continue to remain elevated. Even several interventions by the regulator may not have a substantial impact on quotations, as these operations are likely to be offset by global market positions, as has happened on several occasions before.
The dollar’s decline at the end of last week was one of the most significant this year, and amid the latest correction, the USDX index remains near 100.60. The negative movement began after the release of labour-market data showing signs of weakness in the sector: non-farm payrolls fell from 129.0 thousand, revised down from 172.0 thousand, to 57.0 thousand, nearly half the preliminary estimate of 110.0 thousand. Unemployment declined from 4.3% to 4.2%, but this was due to a fall in the labour-force participation rate. These figures weakened market expectations for further US Federal Reserve tightening in the near term.
The baseline forecast for the regulator’s meeting on July 29 now suggests that the interest rate will remain unchanged within the 3.50–3.75% range with a probability of 75.9%, which may support the employment segment. Expectations for a rate increase in September have also changed: according to the CME FedWatch Tool, the probability of the Federal Open Market Committee (FOMC) returning to a hawkish stance is now estimated at 44.8%.
Support and resistance levels
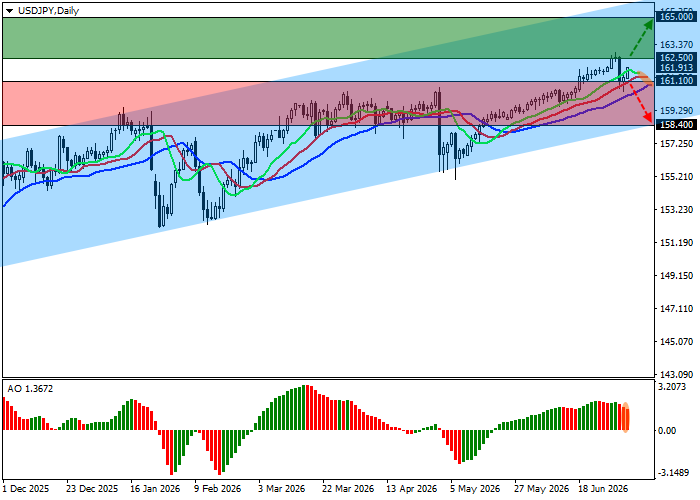
On the daily chart, the instrument is correcting within an upward trend and is attempting to approach the resistance line of the global channel with boundaries at 166.00–158.00.
Technical indicators maintain a stable buy signal: the fast EMAs of the Alligator indicator remain above the signal line, while the Awesome Oscillator histogram is forming corrective bars in positive territory.
Resistance levels: 162.50, 165.00.
Support levels: 161.10, 158.40.
USD/JPY Trading Scenarios and Price Forecast
Long positions may be opened after the price rises and consolidates above 162.50, with a target at 165.00. Stop-loss: 161.50. Expected implementation period: 7 days or more.
Short positions may be opened after the price declines and consolidates below 161.10, with a target at 158.40. Stop-loss: 162.50.
Scenario
| Timeframe | Weekly |
| Recommendation | BUY STOP |
| Entry point | 162.55 |
| Take Profit | 165.00 |
| Stop Loss | 161.50 |
| Key levels | 158.40, 161.10, 162.50, 165.00 |
Alternative Scenario
| Recommendation | SELL STOP |
| Entry point | 161.05 |
| Take Profit | 158.40 |
| Stop Loss | 162.50 |
| Key levels | 158.40, 161.10, 162.50, 165.00 |
